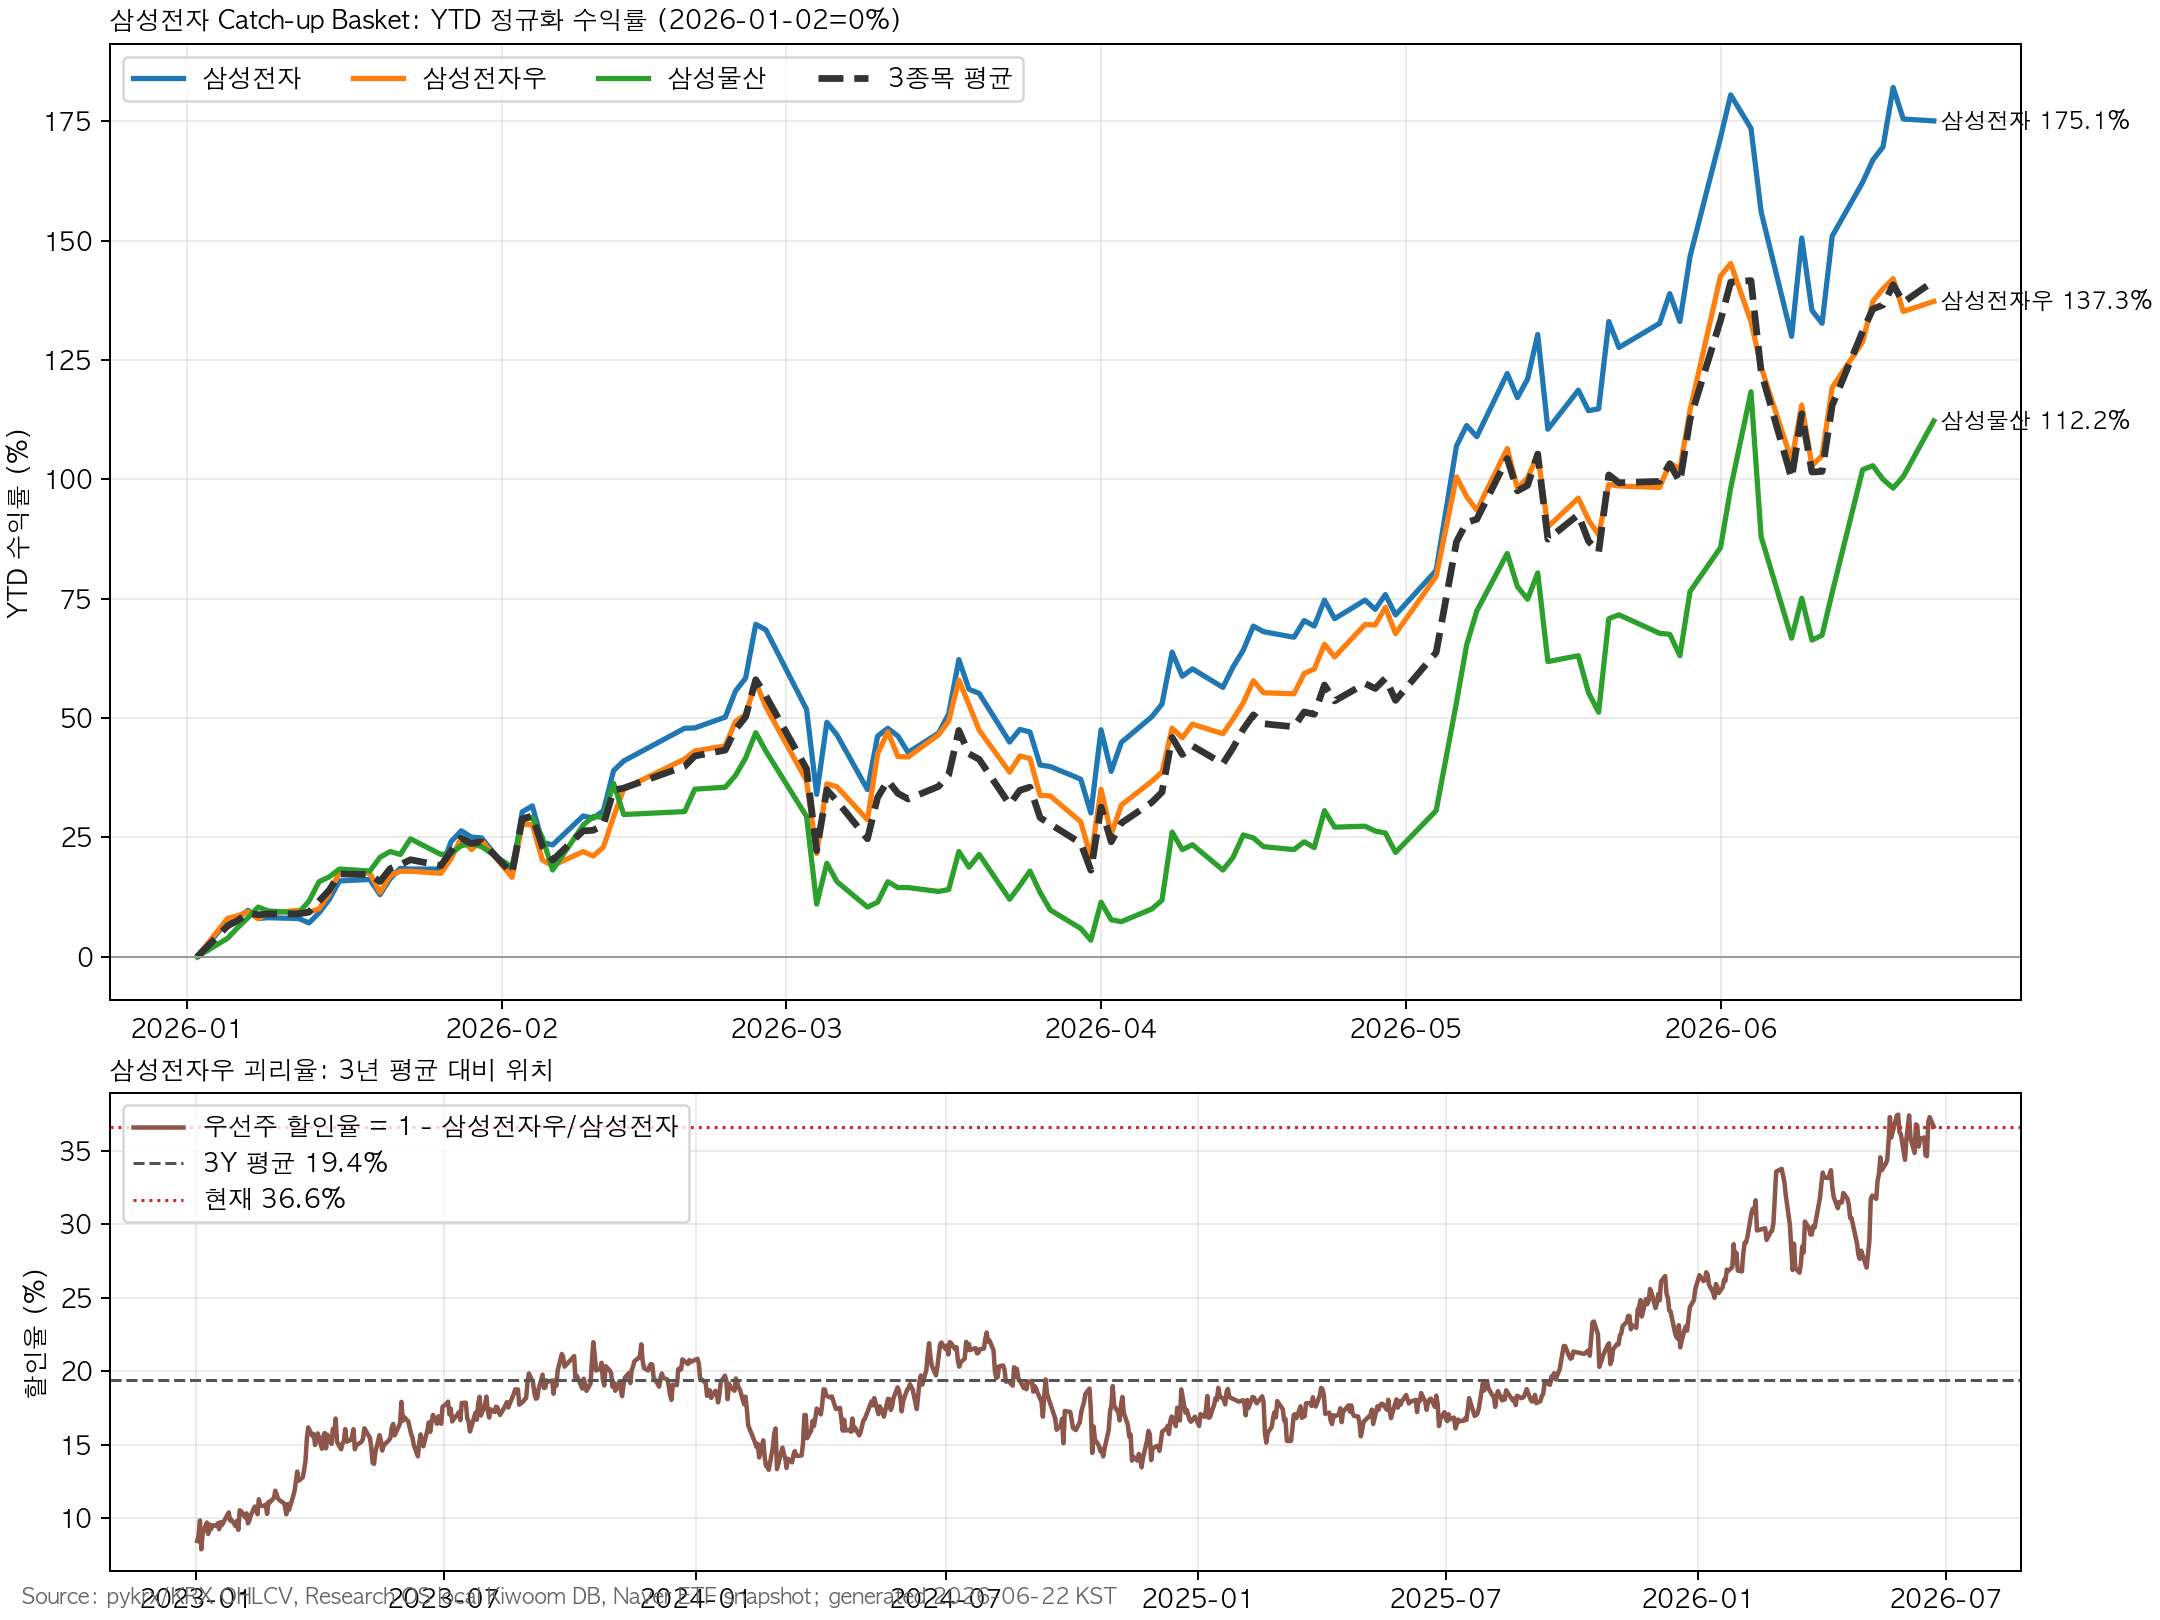
Samsung Electronics preferred is the cleaner catch-up expression. It lagged the common by 37.8 percentage points YTD and traded at a 36.6% discount on 22 June 2026.
The discount is extreme: 36.6% versus a 19.4% three-year average, 18.1% median, +3.11 z-score, and 99.1st percentile.
Samsung C&T is not a one-for-one Samsung Electronics proxy. It is a NAV and affiliate-dividend story.
ETF cap spillover is secondary. A simple redistribution assumption implies only about KRW 24.6bn into Samsung Electronics preferred and KRW 46.0bn into Samsung C&T.
主要データ
Stock
2 Jan Close
22 Jun Close
YTD
Versus Samsung Electronics
Samsung Electronics
KRW 128,500
KRW 353,500
+175.1%
Baseline
Samsung Electronics preferred
KRW 94,400
KRW 224,000
+137.3%
-37.8pp
Samsung C&T
KRW 245,000
KRW 520,000
+112.2%
-62.9pp
Metric
Samsung Electronics
Samsung Electronics Preferred
Samsung C&T
20D return
+18.0%
+19.3%
+24.3%
60D return
+86.3%
+67.0%
+84.7%
Correlation with Samsung Electronics
1.000
0.949
0.779
Beta to Samsung Electronics
1.000
0.912
0.848
優先株ディスカウント
Metric
Value
Preferred/common ratio
63.37%
Current discount
36.63%
Three-year average discount
19.43%
Three-year median discount
18.14%
Current z-score
+3.11
Three-year percentile
99.1%
Preferred/Common Ratio
Implied Preferred Price
Upside
Current 63.4%
KRW 224,000
Baseline
70.0%
KRW 247,450
+10.5%
75.0%
KRW 265,125
+18.4%
80.0%
KRW 282,800
+26.3%
85.0%
KRW 300,475
+34.1%
Samsung C&TのNAV
Samsung C&T is calculated to hold 298,818,100 Samsung Electronics shares. At KRW 353,500, that stake is worth about KRW 105.6tn. Samsung C&T’s estimated market cap is about KRW 84.3tn.
Foreign selling slows, program selling eases, 20-day moving average holds
The key conclusion is that the next Samsung Electronics catch-up alpha is more likely to come from preferred-share discount normalization than from ETF cap spillover.