
Growing 41% a year sounds demanding. Yet Amazon Web Services grew revenue almost that fast for four years. If AI agents turn a cheap answer into a useful piece of completed work, the next four years need not be less ambitious.
My judgment is cautiously positive on that growth possibility. I am less positive on the claim that it automatically makes AI stocks cheap. Microsoft, Alphabet, Meta and Nvidia offer different earnings starting points, capital burdens and prices. Among these four, Meta and Nvidia leave more room for a favorable surprise under a common earnings test. Microsoft already requires substantial execution. Alphabet sits between them.
This follows our analysis of who pays for AI. That article ended with a question: can delegated agents take demand beyond the heaviest users and the largest businesses? Here we test that proposition against historical growth, public interviews, company disclosures, field research and current valuations.
First, 41% is a conditional hurdle
The earlier calculation compared an estimated $414 billion year-end 2026 AI revenue run-rate with our modeled $1.626 trillion of annual AI-attributable revenue in 2030. Four years separate those endpoints. The resulting compound annual growth rate is 40.8%, rounded to 41%.
The endpoint comes from assumptions about the capex path, depreciation, operating costs and a 12% required return. It is an annual capital-cost coverage test, not cumulative sales through 2030 or a promise that every investment earns 12%. The starting point is Tech Fund’s estimate across labs, AI-attributed advertising, cloud, applications and other channels. Neither number is an audited measure of final customer spending.1
That distinction needs more emphasis than it received in the first article. Tech Fund explicitly says it removes cloud sales to frontier labs and app payments to those labs to avoid double counting. We should credit that adjustment. We have not independently reconciled the netting, and AI-attributed advertising gains depend on an assumed revenue path without AI. This is uncertainty about a third-party estimate, not evidence that duplication has been found.
For scale, if the starting revenue were reduced by an illustrative 20% while the endpoint stayed unchanged, the required CAGR would rise to 48.9%. A 40% reduction would raise it to 60.0%. These are denominator stress tests, not estimates of actual overstatement or a fully reconciled alternative model. A consistent alternative model would also revisit the endpoint.
Thus, “41% is feasible” is a useful growth proposition. “41% guarantees the infrastructure pays for itself” is too strong.
History makes 41% plausible, not easy
The comparisons below all cover four elapsed years. Revenue comparisons come first; physical-volume comparisons show how quickly adoption can spread.
| Market and period | Measure | Start → finish | Annual growth |
|---|---|---|---|
| AWS, 2016–2020 | Segment net sales | $12.219bn → $45.370bn | 38.8% |
| Smartphones, 2010–2014 | Worldwide shipment value | $130bn → $393bn | 31.9% |
| Smartphones, 2010–2014 | Worldwide units shipped | 305m → 1,306m | 43.9% |
| Electric cars, 2020–2024 | Worldwide units sold | About 3m → over 17m | About 54% or more |
Sources: Amazon annual disclosures; WIPO’s industry study using IDC data; IEA. CAGR is (finish / start)^(1/4) − 1. EV inputs are rounded. Shipment value and vehicle sales are not software revenue.234
AWS is the strongest comparison for the optimistic argument. It sold metered infrastructure, broadened the tasks customers could run and reached a much larger revenue base. But it was a successful company selected after the fact. Its starting revenue was about one-thirty-fourth of the AI estimate used here. Matching its percentage growth now requires a much larger absolute spending increase. AI revenue of $414bn compounded at 41% would add roughly $1.22tn to the annual run-rate by 2030.
Smartphones supply the necessary caution. Unit shipments grew faster than 41%, but shipment value grew 31.9% because average selling prices fell. EVs demonstrate rapid physical adoption, aided by policy and a small starting base; they do not establish a 54% revenue-growth precedent.
These are selected analogues, not a statistical sample from which to estimate AI’s success probability. They rebut “41% is unprecedented.” They do not prove “41% is easy.”
Cheaper tokens must become cheaper completed work
For a constant mix of metered tokens, revenue equals volume times realized price. A 41% revenue increase with a 40% price decline requires 2.35 times the volume. With a 54% decline, it requires 3.07 times.
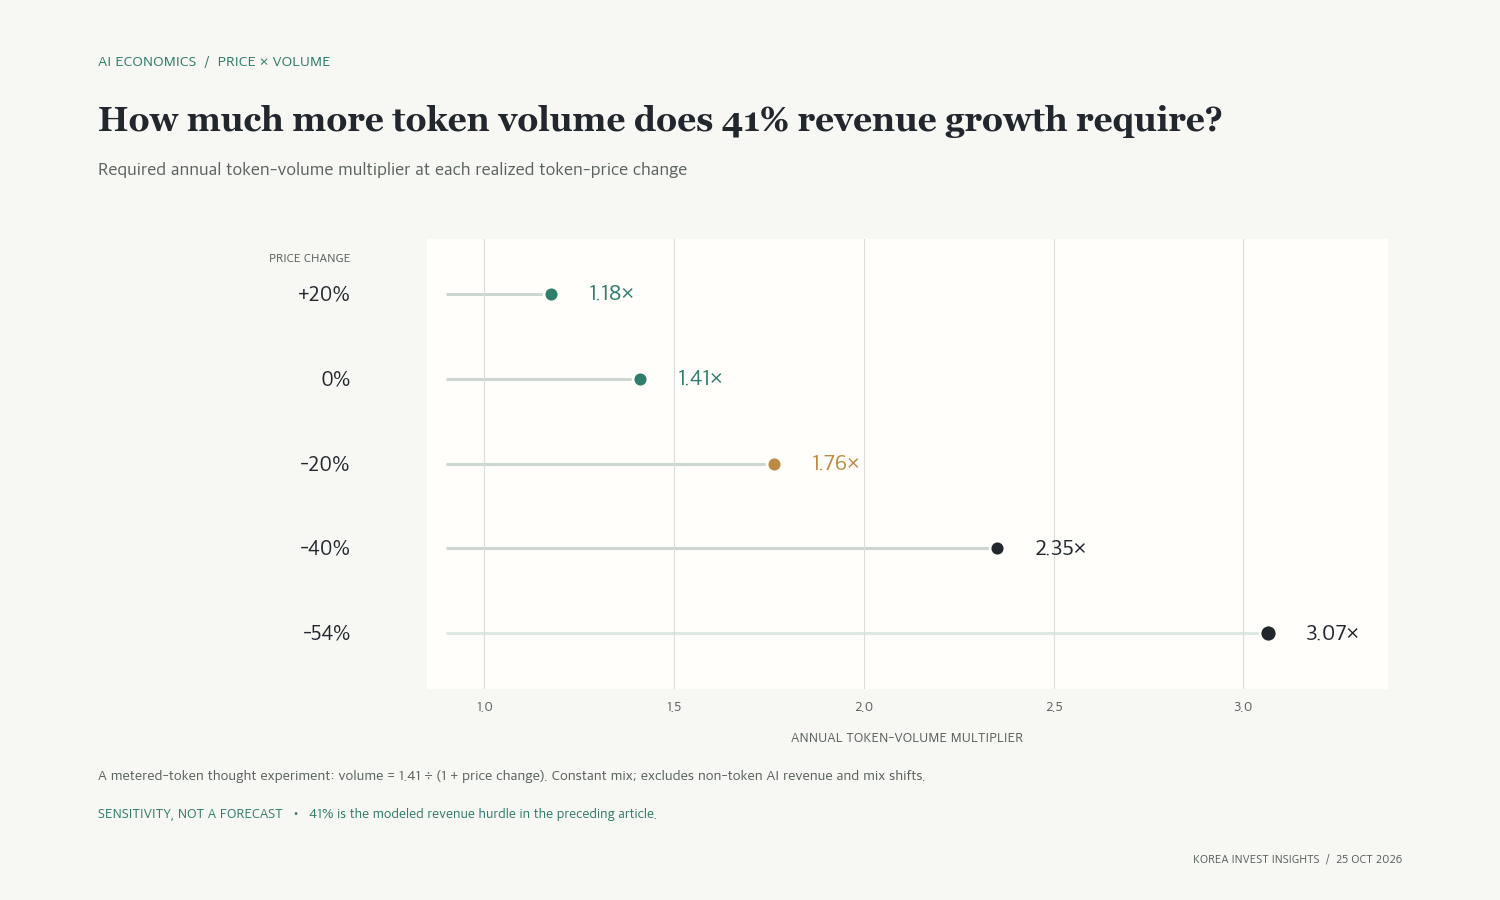
Alphabet reported API throughput rising from 16 billion to 22 billion tokens per minute between the first and second quarters of 2026. That is 37.5% sequential growth. Repeating that quarter four times would produce 3.57 times annual volume, above the two stressed requirements. It is an annualized illustration of one platform’s run-rate, not observed full-year growth, industry growth or four-year evidence.5
Ramp adds a different signal. In its token-management sample, spending in the week ending October 11 rose 23.0% against the week ending September 13, while volume rose 52.4%. This is compatible with demand outrunning falling prices over that window. It does not contradict the earlier article’s August-to-October comparison: the start dates differ. Ramp explicitly says this product sample is not representative of all its AI spending. Its model-specific price series should not be combined mechanically with all-model spending and volume.6
There is also no rule that the realized price must fall 40–54% every year. Quality, model mix, caching, service tiers and temporary capacity shortages change the bill. Subscriptions, advertising and fees for outcomes further weaken a simple token-to-total-revenue identity. A cheaper input can improve a supplier’s margin even when the customer price stays unchanged.
The economic unit to watch is therefore cost per accepted result, including human review and rework. A long agent run that consumes ten times more tokens but produces an unusable result is demand for computing today. It is poor evidence of a renewable customer budget tomorrow.
The agent thesis has three routes out of the early-adopter niche
The thesis is that a packaged agent removes work the customer previously had to do: select a model, connect data, write code, manage context and supervise every step. Customers can delegate a bounded job through a familiar product. That can broaden adoption, increase jobs per customer and make recurring payment easier.
The first route runs through existing enterprise software. In Microsoft’s July 29 earnings call, Satya Nadella reported over 30 million paid Microsoft 365 Copilot seats. He also described a move toward seats plus consumption, with GitHub Copilot revenue growing more than 60% quarter on quarter after usage billing began. One in three GitHub pull requests involved an agent. These are company-reported measures: involvement is not a merged, fully autonomous change, and revenue growth cannot be attributed entirely to extra work.7
The second route is a narrow business workflow sold with setup, permissions and review already built in. Customer support, document intake and routine reconciliation have clearer acceptance criteria than “run my company.” Here a nondeveloper can buy an outcome without building an agent stack. This is our inference about distribution, rather than a measured industry forecast.
The third route is a personal agent distributed through devices and consumer services. Its reach could be enormous, but usage alone leaves the business model unresolved. Free access funded by advertising, a capped subscription and metered autonomous work have different revenue and compute consequences. We do not need consumer autonomy to arrive everywhere for enterprise-agent revenue to grow rapidly. We would need broader consumer proof to justify the most expansive demand case.
Adoption data still draws a boundary. McKinsey’s 2026 survey found the share of respondents at large organizations scaling agents in at least one function rose from 27% to 40%. Smaller organizations stayed around 22%. Only 37% reported any positive enterprise EBIT contribution from AI, essentially unchanged from the prior year. These are survey responses, not audited profits or a count of active agents.8
The “top 1%” also needs a precise label. Ramp ranks firms paying for AI by spending per employee, not individual AI users. In September, the median firm in that top group spent about $9,568 per employee per month, versus $15.70 for the median paying firm. That gap shows concentration of intensity. It does not establish that 1% of people produce a fixed share of global AI revenue.6
What the optimists and skeptics actually disagree about
Jensen Huang’s August 26 earnings-call argument is that agents can keep working in the background and interact with other agents, expanding computing beyond human screen time. That is a credible mechanism for more workloads. As the chief executive of a computing supplier, he also has a direct commercial interest in that outcome. His statement is not independent proof of the budgets required to support it.9
Nadella supplied an important qualification in his February 2025 interview with Dwarkesh Patel. He emphasized real economic growth and inference revenue as checks on supply-side enthusiasm. His argument was that today’s investment must become tomorrow’s customer value before the next investment cycle can be justified. That connects the agent story to recurring payment.10
Andrej Karpathy’s October 2025 interview with Patel offers the strongest timing objection. His phrase was “the decade of agents.” He described impressive tools he already used, alongside substantial work still required to make them reliable employees or interns. His view allows rapid commercial growth during a long transition; it does not imply agents produce no value until the transition ends.11
Research gives both sides something concrete. Erik Brynjolfsson, Danielle Li and Lindsey Raymond’s final published study of 5,172 customer-support workers found a 15% average increase in issues resolved per hour. The gains varied by worker experience. This measures assistance in one workflow, not fully autonomous employment or supplier revenue.12
METR’s early-2025 experiment found experienced open-source developers took 19% longer with the tested AI tools. But its February 2026 update warned that newer measurements were biased by participant selection and difficulties measuring concurrent agents. The researchers thought later tools likely helped more, while describing the measured size of that improvement as unreliable. Repeating the old slowdown as a universal current verdict would be misleading.1314
Daron Acemoglu’s task-based macroeconomic analysis provides another restraint: automating selected tasks does not automatically deliver a vast aggregate productivity gain. His 2024 model estimated at most 0.66% total-factor-productivity improvement over ten years under its assumptions. That is not a forecast of AI-vendor revenue. Vendors can grow faster than GDP by replacing other spending; the distinction does not eliminate the need for useful output.15
Taken together, these sources support a narrower, stronger proposition: agents can create a large new paying market before they become dependable general-purpose employees. Their success depends on choosing tasks whose gains exceed setup, supervision and error costs.
My probability judgment separates growth from payback
My working range is 50–60% for the gross AI-attributable revenue measure used above reaching roughly $1.63tn by 2030, if its definition is held fixed. I place 40–50% on the original capital-cost coverage case, with the earlier 45% estimate inside that range. These are subjective research judgments, not calibrated statistical probabilities. The second range includes uncertainty about margins, revenue overlap, asset lives and how much additional capacity gets built. It is not the first probability multiplied by an independent factor.
The positive weight comes from demonstrated enterprise distribution, real usage-linked revenue and throughput growth compatible with the near-term hurdle. The restraint comes from the much larger starting base, uneven smaller-business adoption and incomplete measurement of customer returns. Historical winners show possibility; they do not supply the probability.
A useful trajectory check is an end-2027 run-rate around $584bn, then $823bn in 2028 and $1.16tn in 2029, using the same definition and exactly 41% growth. Falling below one point would not make recovery impossible. It would raise the later growth required. Changing what counts as AI revenue would not constitute beating the trajectory.
Prices discount company cash flows, not one industry probability
A market can correctly expect strong AI demand and still overprice a particular supplier. Competition may transfer the gains to customers. Depreciation can absorb gross profit. New shares can dilute per-share growth. A growing industry can also contain businesses that destroy capital.
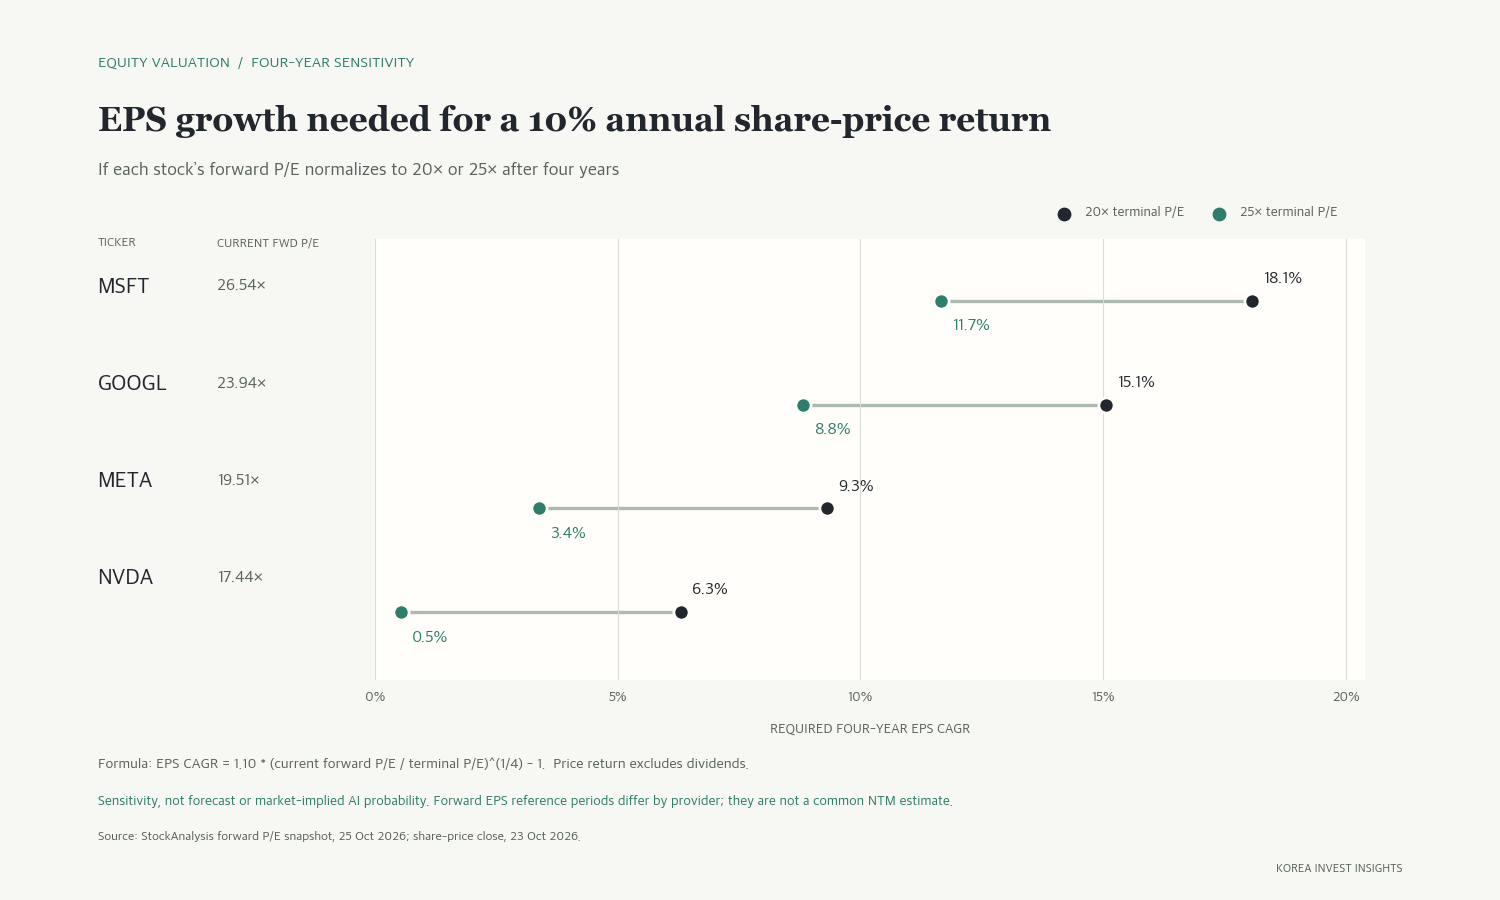
To make the price test concrete, we use one provider’s forward P/E snapshot, retrieved October 25, with October 23 regular-session closing prices. These are vendor-adjusted forward earnings measures, not identical fiscal periods or synchronized 2030 forecasts. We use each quoted earnings base as a reference for a transparent sensitivity test.16
| Company | Closing price | Forward P/E | EPS growth needed with terminal P/E 20x | With terminal P/E 25x |
|---|---|---|---|---|
| Microsoft | $524.51 | 26.54x | 18.1% a year | 11.7% a year |
| Alphabet, Class A | $320.21 | 23.94x | 15.1% | 8.8% |
| Meta | $642.62 | 19.51x | 9.3% | 3.4% |
| Nvidia | $210.96 | 17.44x | 6.3% | 0.5% |
Assumptions: four years of growth from today’s quoted forward-EPS reference, a 10% annual share-price return, and the stated multiple applied to the forward EPS at the end of year four. Dividends are excluded; EPS already includes the share-count effect. Formula: required EPS growth = 1.10 × (current P/E / terminal P/E)^(1/4) − 1. This is an earnings sensitivity, not a full discounted-cash-flow valuation or a price target.
A second calculation shows why an “AI probability implied by the market” is not uniquely observable. Assume only two company earnings paths: 5% or 20% annual EPS growth for four years, a 20x terminal multiple in both cases and a 10% discount rate. The arithmetic weight on the faster path needed to match today’s multiple is about 85% for Microsoft, 63% for Alphabet, 25% for Meta and 7% for Nvidia. These are break-even weights in an invented two-outcome model, not measured investor beliefs or probabilities of 41% industry growth.
Change only the terminal multiple to 25x and the Microsoft and Alphabet weights fall to about 40% and 22%. For Meta and Nvidia, even the slower modeled outcome is worth more than today’s price, so there is no feasible probability between zero and one that equates the model to the quote. That demonstrates dependence on assumptions, not a risk-free bargain.
The discount looks selective
Microsoft: broadly reasonable, with limited room for disappointment. Distribution and consumption billing support sustained growth, but the 20x terminal case requires roughly 18% annual EPS growth after the quoted forward earnings base. The market is already paying for execution. The latest annual filing also contains a $6.5bn OpenAI investment gain and sharply higher depreciation. We use the adjusted forward measure above; we do not project that investment gain as operating profit.17
Alphabet: conditional upside, rather than a blanket discount. Search distribution and cloud demand give it several ways to capture AI spending. Against that, agent answers can alter search monetization and capex must convert into cash. Its apparently cheap trailing P/E is a poor anchor: the first-half filing reports $135.95bn of equity-security gains, mostly unrealized. The 23.94x forward measure asks for about 15% EPS growth in the 20x terminal case.18
Meta: the clearest modest-growth hurdle, with a real cash-flow objection. About 9% EPS growth clears our 20x terminal test. Advertising can monetize better recommendations without asking consumers to buy an agent subscription. But the company reported $85.82bn of nine-month capex including finance-lease principal, against $96.87bn of operating cash flow, and raised 2026 capex guidance to $135–145bn. The low earnings multiple partly compensates for this investment burden. It looks excessively discounted only if durable advertising gains and spending discipline restore cash conversion.19
Nvidia: a substantial discount to earnings durability, not to near-term growth. The low quoted forward multiple starts from a large earnings forecast. A 30% cut to that EPS base would turn 17.44x into 24.91x at the same price. Customer financing, competition and the eventual supply response can make that cut possible. Still, if earnings survive the current buildout and continue growing, its price leaves more room than Microsoft’s under the same terminal assumptions. Nvidia’s disclosed cash generation is also less directly burdened by owning the whole customer data-center estate, though strategic investments and customer concentration still matter.20
My conclusion is therefore selective underpricing of durable earnings, with Meta and Nvidia the stronger cases for further scrutiny. I do not see sufficient evidence that the entire AI trade is excessively discounted. The broad 41% revenue thesis supports these cases; cash conversion and earnings durability decide them. This comparison covers these four companies, not leveraged infrastructure operators or the whole AI stock universe.
For Korean memory suppliers, the link is another step removed. Agents can increase demand for server DRAM, storage and CPUs as well as HBM. Yet model efficiency, caching, utilization, memory supply and contract prices decide the revenue captured by suppliers. A successful agent thesis alone does not establish that a memory stock is cheap.
The next evidence must connect usage to renewal
| Question | Evidence that would strengthen the case | Evidence that would weaken it |
|---|---|---|
| Does distribution reach beyond large firms? | Smaller-firm agent scaling rises above the current 22% survey baseline, with paid renewals | Deployment rises only in large firms; smaller-firm adoption stays flat |
| Does usage become revenue? | Comparable cohorts show rising retained paid work and net revenue | Tokens grow while recurring spending and retention stall |
| Do customers earn the saving? | Review-inclusive cost per accepted task falls and quality holds | Human supervision and rework absorb the saving |
| Can shareholders keep the gain? | Operating cash flow outgrows recurring capex and dilution | EPS rises while cash conversion deteriorates persistently |
| Is the four-year path intact? | Same-definition revenue approaches the $584bn end-2027 reference | Growth depends on relabeling existing revenue or adding overlapping layers |
The coming earnings releases and subsequent paid-use data can test the first steps. Four years of compounding will require repeated evidence, not one spectacular quarter.
If you use an agent at work, what matters more to renewal: tokens consumed, tasks attempted, or tasks accepted without substantial rework? That is the operating question behind this investment debate.
Interest disclosure: This article was prepared with OpenAI tools. OpenAI is discussed as an industry participant. Public information is used; no assessment is made of the magnitude of this same-vendor interest.
This is public-market research, not a recommendation tailored to any reader’s portfolio. Scenarios and valuation sensitivities are assumptions, not promised returns.
Previous article and model assumptions; Tech Fund, October 18, 2026. Third-party year-end revenue estimate and our scenario calculations. The detailed model gives $1.625936tn, so CAGR is 40.775%. Endpoints do not form an audited, consolidated customer-spending series. ↩︎
Amazon 2018 annual report, AWS 2016 segment net sales; 2021 year-end financial update, released February 3, 2022, with the 2020 comparison column. Our four-year CAGR calculation. ↩︎
Jason Dedrick and Kenneth Kraemer, WIPO working paper 41, November 2017, Table 1 using IDC industry data. Shipment value, not the entire smartphone ecosystem’s revenue. ↩︎
IEA, Global EV Outlook 2021 and Global EV Outlook 2025 executive summary. Rounded global electric-car sales; volume, not revenue. ↩︎
Sundar Pichai, Alphabet Q2 2026 remarks, July 22, 2026. Company-reported API run-rates. Annualization is our calculation. ↩︎
Ramp AI Index, retrieved October 25, 2026; September company-spend observations and token week ending October 11. Company and token-product samples have different coverage. The percentile is across firms, not people. ↩︎ ↩︎
Satya Nadella and Amy Hood, Microsoft FY2026 Q4 earnings transcript, July 29, 2026. Paid seats, GitHub involvement and product revenue have distinct definitions. ↩︎
The state of AI in 2026, August 25, 2026. Survey of 1,719 respondents in 97 countries, fielded May 4–June 8; results are self-reported. ↩︎
Jensen Huang, Nvidia Q2 FY2027 earnings transcript, August 26, 2026, background-agent discussion. Management’s forward-looking view. ↩︎
Satya Nadella interviewed by Dwarkesh Patel, February 19, 2025, economic growth and inference-revenue discussion. Public interview, not an interview conducted for this article. ↩︎
Andrej Karpathy interviewed by Dwarkesh Patel, October 17, 2025, opening discussion of agent deployment timelines. ↩︎
Brynjolfsson, Li and Raymond, Generative AI at Work, Quarterly Journal of Economics, May 2025. We use the published 5,172-worker, 15% result, not the earlier working paper’s 5,179-worker, 14% version. ↩︎
Becker, Rush, Barnes and Rein, METR early-2025 developer experiment, July 2025; 16 developers and 246 tasks in familiar repositories. Context-specific result. ↩︎
METR’s experiment-design update, February 24, 2026. Selection and measurement problems limit the newer speedup estimates. ↩︎
Daron Acemoglu, The Simple Macroeconomics of AI, May 2024. Conditional ten-year aggregate-productivity model, not a supplier-sales forecast. ↩︎
StockAnalysis statistics: Microsoft, Alphabet, Meta, Nvidia. October 23, 2026 closes; ratios retrieved October 25. Forward estimates depend on the provider and company fiscal year. All reverse-valuation calculations are ours. ↩︎
Microsoft FY2026 Form 10-K. OpenAI investment gains and depreciation are separate from the adjusted forward-EPS sensitivity. ↩︎
Alphabet Q2 2026 Form 10-Q, other income and equity-security gains. These gains are not recurring search or cloud earnings. ↩︎
Meta Q3 2026 earnings release and Form 10-Q. Capex includes finance-lease principal payments. ↩︎
Nvidia Q2 FY2027 Form 10-Q. Customer concentration, investments and cash flows. Earnings cuts used in this article are sensitivities, not company guidance. ↩︎