Seagate reported record earnings and cash generation. Yet its share price fell 10.21% on October 2. Competitor Toshiba announced that day that its expanded data-center HDD production line had made its first shipment.123
Ciena presents another useful case. Revenue for the quarter ended August 1 rose 37%, and its adjusted operating margin reached 22.5%. But its October 2 close of $391.34 was 38.6% below the intraday high of $637.51 on June 3. Strong results and strong shareholder returns can still be far apart.45
Returns from AI bottlenecks do not depend on the size of a price increase alone. What matters is which company keeps the resulting profit, how long it lasts, and whether it turns into cash shareholders can use. The business must also exceed the growth already required by its share price before another re-rating is possible.
For Samsung Electro-Mechanics, the question is whether price increases that once stopped at distributors are reaching direct customers. For Seagate, it is whether high price per unit of storage and the economics of heat-assisted magnetic recording (HAMR) can withstand new competing supply. For Ciena, the issue is that it may spend more to secure components even as it sells higher-priced optical networking equipment. For power equipment, the question is whether the strong economics of new orders turn into earnings and service revenue years later.
The analysis is as of October 3, 2026. Share-price comparisons use each market’s regular-session close on October 2. Results periods and forecast periods are shown separately. Industry pricing forecasts, company results, management commentary, and analytical assumptions are kept distinct. The multiples and sensitivities below are scenarios for testing, not confirmed price targets.
Six links must hold between a bottleneck and the share price
AI infrastructure is not one product. It needs power grids, generators, servers, memory, storage, and optical networking. A shortage in any one of them can delay the use of the others. A supplier of a scarce product may get a chance to raise prices, while a company that buys that component may face cost pressure.
The same bottleneck can mean different things on opposite sides of the supply chain. A shortage of light sources may benefit the companies that make them. For an equipment maker that buys those sources and assembles systems, it may mean longer lead times and higher costs. Both companies can grow AI revenue while their profits grow at different rates.
The figure below shows the links needed to turn a bottleneck into shareholder returns. It is a checklist for finding where an investment case breaks, not a model that guarantees the market will move in this order.
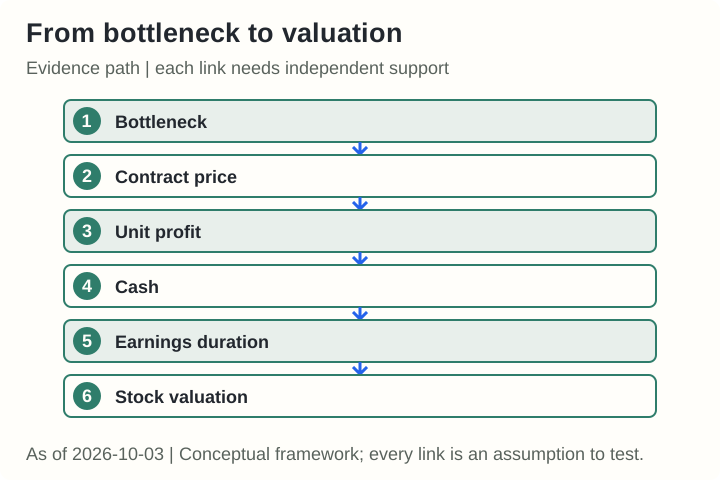
The first link is the price in actual contracts. Spot quotes at distributors can rise while a manufacturer’s long-term supply price stays unchanged. The second is profit per unit. If a price increase only covers raw materials, tariffs, or warranty costs, it creates no excess profit.
The third is shipment and cash collection. A company cannot turn a high order price into revenue if it lacks the components needed to make the product. The fourth is how long earnings last. Competitors’ capacity additions, yield improvements, and customer certifications can bring high prices down.
The fifth is the gap from market expectations. Adding a disclosed contract to the revenue outlook when it is already included counts the same positive news twice. The final link is what the current share price requires. Earnings can rise while the stock falls if the market assigns a lower valuation multiple.
Research therefore cannot stop after finding a scarce component. It must identify who captures the pricing, the contract terms, cash after investment, when competing supply arrives, and the earnings already required by the share price.
Price growth and acceleration help, but they are not universal filters
If P is selling price and Q is volume, revenue is the sum of P×Q for each product. Average selling price (ASP) averages products with different characteristics. ASP can rise when more high-performance products are sold even if the price of each product stays the same.
To measure price growth, compare P for the same specification, unit, and period. If v is the quarter-over-quarter price growth rate, one sign of acceleration is a higher v in the following quarter. An increase from 15% to 20% is a 5-percentage-point increase in the rate of growth. It does not mean the price itself rose by 5%.
Year-over-year comparisons need particular care. If the year-ago comparison quarter had low prices, the year-over-year growth rate can rise even when this year’s price is flat. Revenue growth also includes Q and foreign-exchange effects. Gross margin includes product mix, cost, utilization, and accounting adjustments in addition to P. Combining these indicators into one price-acceleration score may look precise, but it mixes different phenomena.
Acceleration is useful in investing because it can reveal that market expectations may be lagging. But it is neither necessary nor sufficient for a share-price gain. Earnings can rise even as price growth slows if high prices last and costs fall. Company value can also rise without a price increase if new customer qualifications and recurring services become more likely to succeed.
Conversely, a rapid price increase can coincide with weaker earnings if shipments fall or costs rise faster. After identifying accelerating P, return to net price, volume, costs, and duration.
Separate commodity DRAM, HBM, and enterprise SSDs
Using the table in TrendForce’s September 30 release, its quarter-over-quarter price-increase forecast for commodity DRAM declines from 13–18% in Q3 to 10–15% in Q4. NAND overall also slows, from 18–23% to 15–20%. The blended DRAM price forecast, including HBM, rises from 8–13% to 15–20%.6
This comparison shows which products may be accelerating in price. It does not compare the price levels of different products or the earnings growth of individual companies.
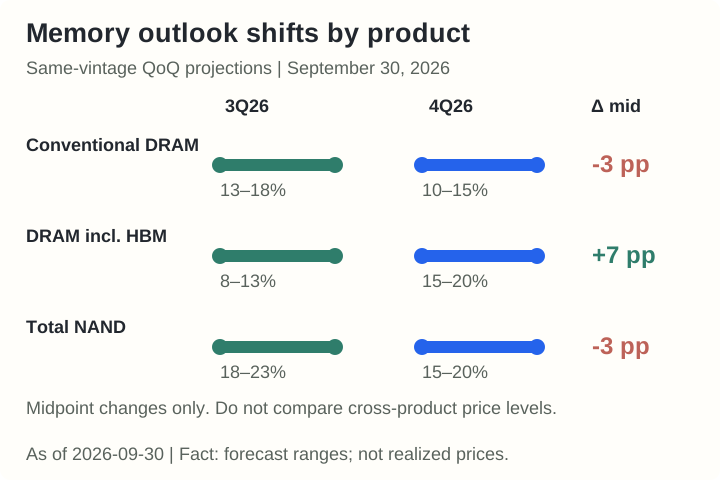
The forecast vintage must also match. The July 3 release forecast a 10–15% NAND price increase in Q3; the September 30 table revised its Q3 estimate to 18–23%. Mixing the older Q3 forecast with the latest Q4 forecast can change an acceleration-versus-deceleration call. The figure compares two quarters from the same, more recent release.76
TrendForce’s forecast of a 121% year-over-year increase in blended HBM ASP for 2027 is a separate measure. The firm cites both supply constraints and a richer mix of higher-priced HBM4 and HBM4e. It should not be read as a 121% pure price increase for the same generation and capacity. Nor should an annual 2027 forecast be compared directly with a quarter-over-quarter forecast for Q4 2026.8
Demand can also adapt to these forecasts. GPU and ASIC makers may reduce the number of HBM stacks per device and build more devices from the same supply. That does not necessarily lower price per unit of capacity. A shortage of an expensive product can drive design changes, and those changes can move the bottleneck again.8
Enterprise SSDs are different from NAND overall. TrendForce identifies enterprise SSDs as the only memory product group whose price-increase pace is expected to accelerate in Q4. That does not mean SanDisk’s company-wide ASP or Micron’s EPS will accelerate at the same rate. Their product mix and contract prices must be checked.6
Slower growth in commodity DRAM and NAND prices does not mean prices are falling. These products may rank lower in a search for the next price shock, but remain important when investing in earnings durability and cash generation. Eliminating Samsung Electronics, SK hynix, Micron, and SanDisk based only on an industry price-acceleration screen asks too narrow a question.
For Samsung Electro-Mechanics, watch the move to direct customers, not just the increase rate
Samsung Electro-Mechanics has relatively clear evidence connecting current prices with next-quarter pricing. On August 27, TrendForce said Q4 price adjustments were expanding from distributors to direct OEM and ODM customers. Its forecast average increase was 25–30% for consumer X5R and 10–20% for AI-server X6S, depending on customer negotiations.9
This is an industry forecast. It does not mean the company’s total revenue will rise by those percentages or that every customer contract has already been signed. The consumer-product increase is also intended in part to manage orders and free capacity for higher-specification products. AI-server products are not guaranteed to receive the largest increase.
Samsung Electro-Mechanics’ change is closer to an expansion in the range where the manufacturer can charge higher prices to direct customers than to rising increases for the same product every quarter. Calculating a blended company-wide increase without knowing the revenue shares of distributors and direct customers would introduce a large error. One Q4 forecast is not enough to call “P acceleration confirmed.”
The half-year report shows price changes that have already appeared. Average ASP in the first half of 2026 was up 13.9% year over year for MLCCs and 18.7% for semiconductor package substrates. Average purchase prices for key inputs were up 8.6% for paste and powder, and 17.4% for CCL and PPG, respectively.10
| Disclosed first-half averages | Selling-price change | Average purchase-price change for key inputs | What investors should keep in mind |
|---|---|---|---|
| MLCCs | +13.9% | +8.6% | A clue to net-price contribution. These are not same-SKU prices or operating margins. |
| Semiconductor package substrates | +18.7% | +17.4% | ASP may reflect higher-end products as well as higher input costs. |
| Camera modules | +2.4% | Sensor IC −0.5% | Not all company revenue is exposed to the same AI bottleneck. |
The 5.3-percentage-point difference between 13.9% and 8.6% is not an improvement in operating margin. Input-cost shares, yield, foreign exchange, product mix, and fixed costs differ. The filing supports the fact that prices rose, but how much of that increase remained as net profit is a separate question.
Price increases at existing plants and investment in new substrate plants are different
Second-quarter component revenue was KRW 1.6494 trillion (KRW 1,649.4 billion). This segment includes MLCCs and represented about 47.7% of consolidated revenue. Package solutions accounted for 22.3% and optical solutions about 30.0%. A price increase for one product cannot be applied to total consolidated revenue.11
Renegotiated prices at existing MLCC plants can affect earnings relatively quickly. FC-BGA expansion must pass through initial investment, yield ramp, customer qualification, and depreciation before it generates cash. Combining the two and saying “AI components are scarce, so earnings will rise immediately” ignores both timing and cost.
The planned investment totals KRW 6.78 trillion: KRW 4.27 trillion in Sejong and KRW 2.51 trillion in Vietnam. The company has said customers will support investment and secure medium- to long-term volumes. Sejong production is targeted for September 2028; completion and operation in Vietnam are targeted for June 2030.12
Customer support is an important change that may reduce demand and financing risks. But public materials do not disclose the support amount, repayment or revenue-offset terms, or a price or margin floor. Do not present the claim that “customers paid more than 70% of investment as an advance” as a confirmed contract term.
A separate MLCC and inductor supply agreement disclosed on September 29 was worth about KRW 285.0 billion, with a 2027 supply period and no contract deposit or advance payment. It should not be combined with the substrate-investment support arrangement. Volume commitments, investment support, and price increases represent different rights and obligations.13
Earnings can rise while cash after capital spending falls
Second-quarter consolidated operating profit was KRW 440.4 billion. Operating cash flow for the same quarter was KRW 556.8 billion, while purchases of property, plant, equipment, and intangible assets were KRW 603.9 billion. Their simple difference is negative KRW 47.1 billion. The same calculation for the first half is positive KRW 166.8 billion, so one negative quarter should not be generalized into a structural lack of cash generation.14
The figure separates accounting earnings from cash left after investment.
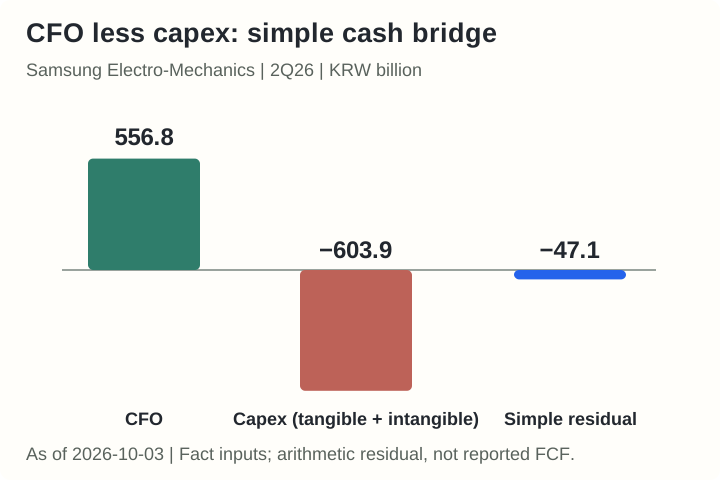
This figure may fall during an expansion cycle. That does not make the investment itself bad. But to justify a high valuation multiple, the returns from new capacity must exceed investment and working-capital needs. Customer support may reduce the risk, but it does not guarantee the outcome.
The key is how much the price effect exceeds expected earnings
Assume price increases apply to 60% of component revenue of KRW 1.6494 trillion, and 70% of incremental revenue remains as operating profit. The 60% and 70% are illustrative assumptions, not disclosed contract terms. Volume and foreign exchange are held constant.
Additional quarterly operating profit = KRW 1,649.4bn × 60% application share × price increase × 70% profit retention
| Assumed price increase | Calculated additional operating profit | As a share of Q2 consolidated operating profit |
|---|---|---|
| 10% | about KRW 69.3bn | 15.7% |
| 15% | about KRW 103.9bn | 23.6% |
| 20% | about KRW 138.5bn | 31.5% |
This is a sensitivity, not an earnings forecast. If the market has already priced in the effect, it cannot be added again as incremental profit. If the applicable share is half as large, the effect is also halved. Customer discounts, higher costs, or lower shipments would reduce it further.
The research questions for Samsung Electro-Mechanics are the earnings contribution from direct contract prices, the economic terms of customer support, and returns on capital after expansion. If the next results show these factors are better than expected, the case for maintaining a high multiple strengthens. If ASP rises while cash after investment worsens, further multiple expansion should wait.
Seagate brings price, technology, and cash together, but the supply response has begun
Seagate is one of the clearer cases where bottleneck economics show up in reported results. Revenue for FY2026 Q4, ended July 3, was $3.629 billion. Adjusted gross margin was 52.7%, adjusted operating margin was 44.6%, and full-year FCF was $3.1 billion. Price, product mix, and execution all contributed; price alone did not.1
In the earnings-call transcript posted on the company’s investor-relations site, an analyst interpreted price per unit of storage as rising from about 10% year over year in the June quarter to around 20% in the September quarter. The CFO agreed with the direction of price improvement. This is not a realized September-quarter price series or a same-specification price index. The company also discussed customer contract renegotiations and demand for incremental capacity.15
For HDDs, distinguish the number of devices from storage capacity. HAMR allows more data to be stored on the same device. It can increase total capacity without a large increase in device count, but it also affects the manufacturing complexity and yield of heads and media. Profit can improve even if selling price per unit of capacity falls, provided costs fall faster.
The Seagate thesis is therefore broader than an HDD price increase. It depends on demand, customer contracts, the cost benefits of a technology transition, and new competing supply. Earnings can rise even if price acceleration slows when technology costs improve. Cash recovery can still lag if yields are poor, even while prices stay high.
The number of agents matters less than the data they retain and for how long
If AI agents work for extended periods in virtual computers, originals, work products, logs, and backups can accumulate. Storage that frequently reads and writes small files during execution plays a different role from storage that keeps completed work for years. Assigning one HDD to every agent is not a sound demand estimate.
Start with data that actually remains. Assume 100 million active agents work every day; HDDs hold 60% of new data after deduplication, compression, and deletion; and replication and protection require a 1.5× physical-storage multiplier. Assume data is retained for 365 days. This is not a forecast measured from actual usage or storage configurations.
| Assumed net new data retained per agent each day | Additional HDD physical capacity over one year |
|---|---|
| 100 MB | 3.3 EB |
| 1 GB | 32.9 EB |
| 5 GB | 164.3 EB |
In decimal units, 1 EB equals 1 billion GB. The exact calculation for the middle case is 100 million × 1 GB × 365 days × 60% × 1.5 = 32.85 EB. If data were deleted after 30 days at the same level of activity, retained capacity could stay around 2.7 EB. Data generated over time is different from the stock of data still being retained.
This incremental capacity is a market-wide assumption, not a confirmed Seagate order. It does not account for existing free space, supplier share, or conversion into purchases of new devices. If customers already include agent adoption in their plans, demand that rises as expected may not create a new price shock.
In an analyst question about agentic AI on Seagate’s earnings call, management also said it needed to observe contextual demand by application. Wider use of agents is a hypothesis supporting the durability of storage demand. To connect it to renewed price acceleration, check net data retained above existing plans, incremental EB orders, and capacity pricing on new contracts. Do not assume this demand automatically offsets Toshiba’s expansion.15
Toshiba’s near-doubling is not a near-doubling of the whole market
Toshiba’s official announcement on October 2 marked progress beyond a proposed expansion. Production had begun at its expanded nearline HDD line in the Philippines, and the first shipment had been made. The company’s target is to nearly double annual production capacity, measured by storage capacity, in FY2027 compared with FY2025.3
The figure fixes the denominator used in that announcement.
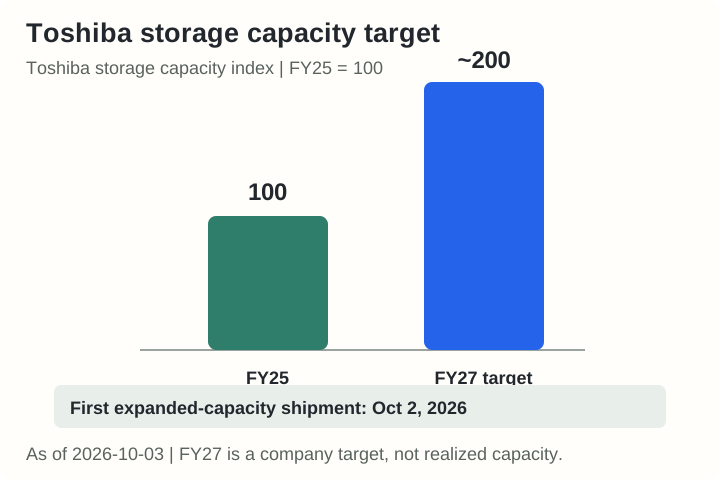
The event should not be dismissed because Toshiba is a smaller competitor. Pricing may respond more to marginal supply competing for new contracts than to total market share. The timing when additional capacity passes major-customer qualification and reaches delivery matters. Conversely, a capacity target alone does not mean every incumbent’s long-term contract will immediately be repriced.
Seagate closed at $848.99 that day. Its 10.21% daily decline is consistent with concern that competing supply could shorten the period of scarcity. The analysis has not separately identified the announcement as the cause of the entire decline.2
The conclusion that Seagate is a “price-acceleration candidate” therefore comes with a supply-side counterargument. The next company update should be checked for price per unit of storage, customer-contract retention, HAMR yield and cost, and competitor qualifications and shipments. A technical rebound alone would not resolve these questions.
A good business can still need high earnings at today’s price
At an assumed 25× P/E, EPS of $33.96 would support Seagate’s $848.99 share price. At the same multiple, EPS of $40.75 would be needed for the share price to rise another 20%. The 25× multiple is a reverse-valuation assumption, not a fact about fair value.
The following is an independent FY2027 sensitivity. Revenue and cost inputs are in billions of dollars. It is a simplified adjusted-earnings model that subtracts net other costs and applies a tax rate and diluted share count.
EPS = (Revenue × gross margin − operating expenses − net other costs) × (1 − tax rate) ÷ diluted shares
| FY2027 analytical assumption | Bear | Base | Bull |
|---|---|---|---|
| Revenue ($bn) | 16.0 | 18.5 | 21.0 |
| Gross margin | 50% | 58% | 62% |
| Operating expenses ($bn) | 1.35 | 1.35 | 1.40 |
| Net other costs ($bn) | 0.18 | 0.15 | 0.12 |
| Tax rate | 16% | 16% | 16% |
| Diluted shares | 232 million | 232 million | 232 million |
| Calculated EPS | $23.43 | $33.42 | $41.64 |
| Assumed P/E | 18× | 25× | 30× |
| Calculated share price | $422 | $835 | $1,249 |
| Change from $848.99 | −50.3% | −1.6% | +47.1% |
These are not company guidance or consensus estimates, and no probabilities are assigned to the scenarios. Base-case revenue of $18.5 billion is about 51.7% above FY2026, with a much higher assumed margin. Even with that strong growth, the current price is roughly in line with the 25× case. The economic cost of stock-based compensation excluded from adjusted earnings and additional dilution need separate review.
For Seagate to rise further, the case must support earnings above this model or a higher multiple that lasts. After the competitor-supply news, the key question is not simply how far the stock has fallen, but how long high prices and the technology economics can persist.
Read Lumentum’s high margins by separating price from product mix
Lumentum, which makes light sources, occupies a different position from equipment makers that buy optical components. In FY2026 Q4, ended June 27, adjusted gross margin was 50.4% and adjusted operating margin was 36.6%. The company’s next-quarter adjusted operating-margin outlook is 39.5–40.5%. This is an example of high profitability appearing upstream in the supply chain.16
But the entire margin cannot be explained by price increases for the same product. The mix of new light sources and modules, higher-value products, volume, and costs also changes. The higher ASP from a transition from 100G to 200G is a different effect from repricing a contract for the same specification.
The gap between GAAP and adjusted measures is also large. The company reported a FY2026 Q4 GAAP net loss of $7.2 billion, mainly from a one-time, noncash loss tied to the conversion of convertible notes. Adjusted net income was $326.3 million. The noncash loss should not be treated as a recurring operating loss. But focusing only on adjusted measures should not erase share-count growth or the economic cost of stock-based compensation.16
Lumentum merits deeper research into pricing power and technology demand. Rather than declaring the opportunity “fully priced” based only on distance from a high or average analyst target, test whether additional earnings can exceed the high expectations embedded in the current share price. Conversely, its position at the top of the bottleneck does not automatically justify a higher multiple.
Ciena spends money to secure supply even as it raises prices
Ciena supplies optical networking for links between data centers and across networks. As AI computing is distributed across locations, fast connections are needed. But for a company building the final equipment, component shortages create both an opportunity to raise prices and a procurement constraint.
The official figures in the September 3 earnings release are strong. Revenue for FY2026 Q3, ended August 1, was $1.6711 billion, up 37% year over year. Adjusted gross margin was 46.4%, adjusted operating margin was 22.5%, and adjusted EPS was $2.11. These differ from GAAP gross margin of 45.4%, operating margin of 18.0%, and EPS of $1.83.4
In a republished earnings-call transcript, management described price increases ranging from the high single digits to the high teens or low twenties, depending on customer and product. The company said it was applying adjustments to some of its backlog as well. These increases do not apply uniformly to all revenue, and even an agreed price enters revenue only as deliveries occur.17
On the same call, management cited an $8.5 billion backlog and expected it to exceed $10 billion by the end of FY2026. Its initial direction for FY2027 revenue was around $8.3–8.4 billion, with upside if supply increases. These are management outlook statements from the transcript. The full cancellation, delivery, and pricing terms of the backlog were not reviewed.17
The SEC 10-Q reports $2.5 billion of remaining performance obligations (RPO) for non-cancelable customer orders as of August 1. This is not defined on the same basis as management’s $8.5 billion backlog. Do not treat the whole backlog as contractually committed revenue. Nor should the full difference between the two figures be described as cancelable orders.18
Watch the gap between the price-increase rate and gross margin
The initial FY2027 outlook is for adjusted gross margin of 45–46% and operating margin of 25–27%. Q3 FY2026 gross margin of 46.4% included about 70 basis points of tariff refunds, according to the call. Simply removing that amount gives about 45.7%. FY2027’s range around this level shows why a large price-increase rate does not necessarily mean a large increase in gross margin.1719
The figure separates reported results, next-quarter guidance, the initial next-year outlook, and medium-term targets. They should not be read as results confirmed at the same point in time.
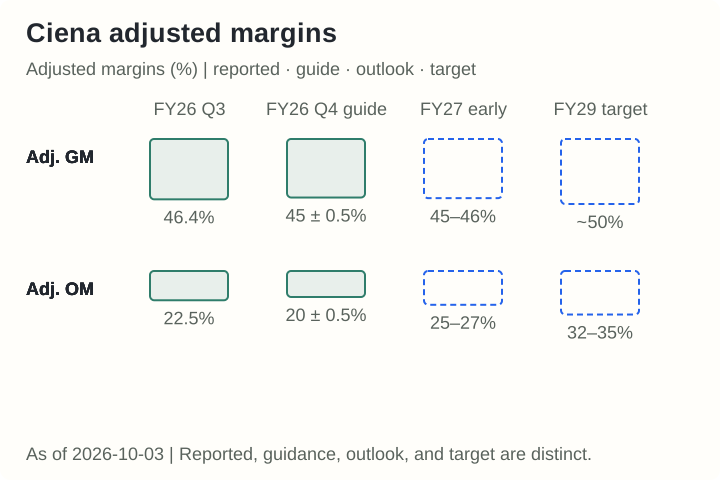
Price increases may phase in over several quarters. A richer mix of high-growth interconnect products may lower gross margin, or component and capacity procurement costs may absorb the increases. The company may also be giving a conservative outlook. Public information does not isolate the effect of each factor in basis points.
This is Ciena’s key open question. Each quarter in which price increases take effect needs an explanation linking net-price contribution, product mix, and component cost. Multiplying an increase rate by total company revenue and counting it all as incremental profit erases the gap.
Operating margin can improve through another path. If revenue rises faster than research, development, and selling costs, operating margin can increase even without a large increase in gross margin. A 45–46% FY2027 gross-margin range alone therefore does not disprove all pricing power. The absolute scale of growth and the cost structure must be considered together.
Backlog growth and cash growth can diverge
The official Q3 materials report operating cash flow of about $196 million and FCF of $116 million. FCF was below the $135 million reported for the prior-year quarter. Revenue and earnings growth rates do not have to match cash growth rates.19
The $2.875 billion zero-coupon convertible notes issued in June also need careful interpretation. They can lower interest costs on existing debt and provide funding to secure supply. The full proceeds should not be treated as advance payments for components. “Interest-free” does not mean there is no economic cost, dilution risk, or maturity obligation.18
The company secures component supply through multi-year supply agreements, purchase commitments, and advance payments. That spending may increase its ability to grow but can delay near-term cash recovery. For Ciena, the key is not only total backlog but cash flow connecting actual shipments, customer collections, supplier advances, and working capital.
Customer concentration of 41.7% is the other side of high growth
In Q3, two customers each accounted for at least 10% of revenue and together represented 41.7%. Large customers with strong demand have helped the business grow quickly, so a change in one customer’s order timing can affect results. The broad outlook for AI spending does not offset customer-concentration risk by itself.18
In technology competition, actual customer qualification and commercial-supply timing matter more than company-specific process labels. The effect of roadmaps from competitors such as Nokia and Cisco on Ciena’s pricing, costs, and share is important. However, this review did not confirm from official primary documents either a second-half 2027 launch for a specific 2nm product or a specific purchase amount from Nvidia. Neither was included in the base earnings model.
A company raising prices does not necessarily capture the largest share of bottleneck profits. If it must pay more to suppliers upstream, part of the price increase moves back up the supply chain. The question is whether Ciena’s differentiated technology can sustain profits above that cost.
A decline from the high and actual multiple compression require matching denominators
Dividing the October 2 closing price of $391.34 by an assumed FY2027 adjusted EPS of $12 gives 32.6×. The $12 figure is neither company guidance nor verified consensus. Dividing the June 3 intraday high of $637.51 by the same EPS gives 53.1×. This is a sensitivity using the same denominator, not a reconstruction of the observed forward P/E at the time. The decline between the two share prices was 38.6%.5
Comparing a multiple calculated using an earlier, lower EPS forecast with today’s multiple using a higher EPS forecast combines a falling share price with rising earnings estimates. The entire difference cannot be called “multiple compression.” To compare expectations at the two dates, use the same fiscal year and the same adjusted-earnings definition.
Nor does 32.6× automatically mean the shares are cheap. At EPS of $12 and a 32× P/E, the calculated share price is $384, near the current price. If EPS is $16 but the market assigns 24×, the result is also $384. If EPS is $12 and 40× is sustained, the result is $480. All are analytical assumptions.
The company has set FY2029 targets of about 30% compound annual revenue growth, adjusted gross margin of about 50%, operating margin of 32–35%, and FCF margin of about 20%. Applying 30% growth three times to the midpoint of FY2026 revenue guidance of $6.42 billion yields about $14.10 billion. The often-cited “$14 billion in 2029” is the result of this calculation, not a separate confirmed revenue figure stated in the target announcement.20
Further re-rating would require evidence of earnings above the initial outlook, a contribution from net pricing to margin, cash conversion, lower customer concentration, or sustained high earnings. A large decline from the peak may justify research, but it is not a buy conclusion.
Power-equipment prices are strong; continued acceleration and company-level capture are separate questions
The U.S. producer price index for power and specialty transformers rose about 4.0%, from 456.602 in June to 474.831 in July. Its year-over-year increase rose from about 4.0% to 7.8%. But the index was 475.065 in August, only about 0.05% above July.21
Including July’s step-up and the subsequent plateau in the same figure changes the interpretation.
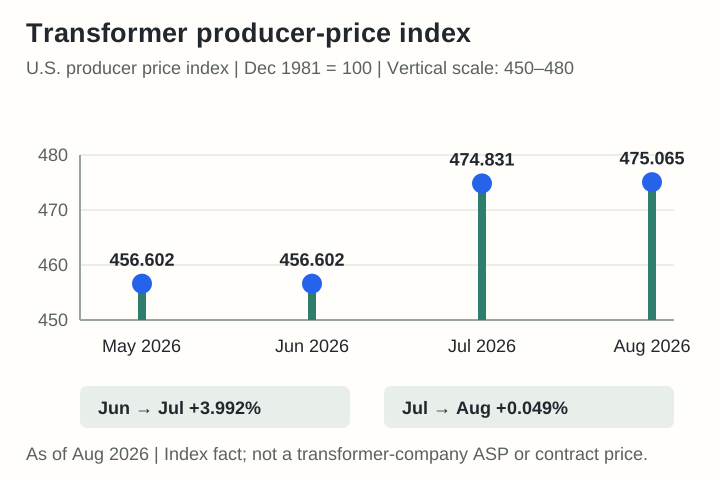
This index supports the view that U.S. industry pricing conditions strengthened. It does not show that Hyosung Heavy Industries’ same-specification contract prices continue to accelerate. Industry prices, a company’s U.S. revenue share, the economics of new orders, and delivery timing must be kept separate.
A securities-firm review of Hyosung Heavy Industries’ Q2 reports a 20.2% operating margin for the heavy-industry segment, 4.3 percentage points above the prior-year quarter. Its U.S. revenue share also rose from 23% to 38%. Do not describe the move from 15.9% to 20.2% as sequential growth from the prior quarter. A shift toward higher-margin regions contributed to the margin change.22
If another power-equipment maker’s margin rises less while U.S. PPI increases, that alone does not prove its prices were flat. Existing orders converting to revenue, product mix, factory costs, and one-time items can differ. Comparing Hyosung Heavy Industries and HD Hyundai Electric is useful for testing whether companies in the same industry actually receive the same P.
GE Vernova’s 116 GW combines backlog and slot reservations
GE Vernova’s official Q2 release says its gas-equipment backlog and production-slot reservations together rose from 100 GW to 116 GW. The company expects at least 125 GW by year-end. On the call, it broke the 116 GW into a 53 GW order backlog and 63 GW of slot reservations. They are not all backlog with the same level of contract certainty.2324
Price comparisons must also use the same base date. Management said prices per kW on new equipment orders in the first half were more than 20% above Q4 2025 orders. For the second half, it expects prices near the top of a 10–20% range versus that same Q4 2025 base. These figures cannot be compounded as +20% in the first half and another +20% in the second half. Management also discussed the mix effect from higher-priced models and combined-cycle equipment.24
GE Vernova’s broader case rests on the strong economics of new orders, the installed base to be delivered, and service revenue from those units. The price of the same product does not need to rise faster every quarter. What matters is whether secured high prices later convert into earnings and cash.
For Doosan Enerbility, look at a reduction in the new-supplier risk discount
Doosan Enerbility announced plans to supply seven 380 MW-class gas turbines and generators to the United States, with sequential deliveries starting in May 2029. It did not disclose the contract value or the unit price compared with an earlier contract for the same model. GE Vernova’s price increases cannot be transferred to Doosan’s realized selling-price growth.25
The company has also secured a KRW 480 billion long-term service contract for three domestic units. This is the total contract value, not annual revenue or profit. Commercial operation at the plants is targeted for December 2029. Distinguish equipment orders from units already operating if valuing recurring service revenue.26
During a supply shortage, a new supplier can enter because incumbent suppliers have long lead times. As operating history and quality validation build, customers may demand a smaller risk discount. If this hypothesis proves right, a new supplier’s earnings could improve without the industry’s prices accelerating further. Public contract prices have not yet demonstrated this.
The TerraPower manufacturing contract marks business progress. It creates a path to value through successful initial production and repeat orders; it does not make every SMR plan confirmed volume production revenue. First-of-a-kind work can carry high learning, inspection, and rework costs even at a high selling price.27
U.S. investment changes the probability and timing of orders before it changes prices
On October 1, the South Korean government selected Texas gas-fired power as its first strategic-investment project, described nuclear power as a framework agreement, and said work had begun to review Alaska LNG. These are different stages, not orders with the same level of certainty. The government’s total investment is not Doosan’s order value or an advance payment to Doosan.28
On the nuclear framework, Cameco described six AP1000 units and up to two APR1400 units, for a maximum of eight. Conditions remain around final contracts, sites, permits, and financing. The framework is explicitly non-binding. More nuclear-power proposals do not mean equipment has been allocated to Doosan.29
The investment case changes if these conditions are met. Lower financing uncertainty can turn a proposed plant into a customer that secures an actual production slot. Long-lead equipment can be ordered and production can begin before the final plant is complete.
Expected project contribution ≈ probability of execution × order-win probability conditional on execution × present value of net cash attributable to the company
Even with unchanged prices, higher probabilities earlier in the chain or faster cash recovery can increase expected value. At an assumed 10% discount rate, receiving the same cash two years earlier raises present value by 21%. This is not a forecast that an actual project will be accelerated by two years. Financing or supplier-slot delays, or a customer demanding lower prices in a bundled order, could change the earnings.
Doosan should therefore be assessed through more than confirmed P acceleration, and its value should not be estimated by applying a manufacturing margin to the government’s announced investment total. Test the case through actual orders, production-capacity allocations, economics of new orders, and recurring service.
Doosan’s selling-price increase alone cannot explain the value of the whole company
An illustrative sensitivity helps indicate scale. Assume 12 turbines a year, KRW 200 billion per turbine, a 20% price increase, 70% of incremental revenue retained as operating profit, and 75% of that profit retained as after-tax earnings attributable to controlling shareholders. The resulting incremental net income would be KRW 252 billion a year. This is a sensitivity, not an actual unit price, sales volume, or contract margin.
12 units × KRW 200bn × 20% × 70% × 75% = KRW 252bn additional annual net income
If this additional profit recurred every year, a strong assumption, applying a 25× P/E would imply equity value of KRW 6.3 trillion. If it took 3.25 years to approach that value and the discount rate were 10%, its present value would be about KRW 4.62 trillion. The 25×, 10%, and 3.25-year inputs are all analytical assumptions; this is not a full discounted-cash-flow model.
This does not apply 25× earnings from a one-time order for 12 units. A one-off order should be valued as a finite cash flow. Any price effect already included in market expectations must also be removed. Better gas-turbine pricing matters, but assessing total shareholder value also requires nuclear, steam turbines, services, equity investments, and investment needs.
Long-term contracts can raise the earnings floor and cap the price upside
During a shortage, customers secure supply through long-term contracts and advance payments. Suppliers may reduce the financing and utilization risks of expansion. But long-term contracts can also limit opportunities to renegotiate prices. A high contract count does not mean all the upside in net pricing is open.
Review minimum purchase volumes, cancellation and repayment rights, price-adjustment formulas, cost and currency pass-through, delivery obligations, and the accounting for advances. A large contract value can still limit shareholder value if it requires substantial low-margin supply. Advances arrive with future delivery obligations.
Samsung Electro-Mechanics’ customer support and Ciena’s supplier advances show money moving in different directions within the same AI investment cycle. In one case, customers help finance a supplier’s expansion. In the other, an equipment maker pays upstream suppliers to secure capacity. Contract terms determine which party bears more risk and captures more profit.
Earnings also appear at different times. The schedule below separates current price changes from future capacity and delivery milestones. It is not a calendar of confirmed earnings-release dates.
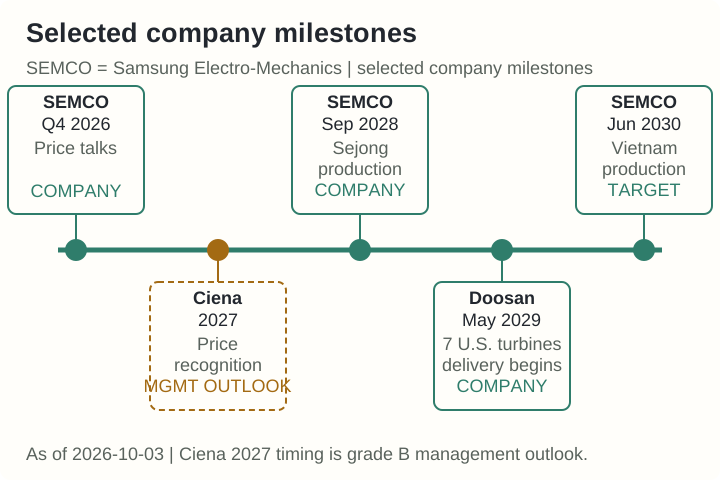
Long lead times can delay competitors’ entry. They also delay cash recovery for shareholders. Applying a high multiple to earnings expected several years from now and comparing it with today’s price without discounting erases this wait. Assess both the duration of growth and the timing of cash recovery.
Instead of one ranking for 28 stocks, map the paths to earnings
Candidates under a price-acceleration screen differ from candidates under a total-investment-attractiveness screen. The table below is not a ranked result. It maps the questions that could change further analysis for each group. Industry signals have not been converted into confirmed company-level prices.
| Review group | Companies | First question to test | Limit of the current interpretation |
|---|---|---|---|
| Direct-customer repricing | Samsung Electro-Mechanics | Revenue subject to actual increases, net margin, and cash after expansion | Broader application of increases differs from acceleration for the same SKU. |
| Price per unit of capacity and technology | Seagate, WDC | Contract retention, price per unit of capacity, yield, and competing supply | Contracts and costs differ even within the same HDD market. |
| Optical-networking price and procurement | Ciena | Margin contribution from increases, component advances, and concentration | Strong orders do not immediately mean strong FCF. |
| Light-source and optical supply | Lumentum, Coherent | Product-level price, mix, contracts, and earnings after dilution | The full margin increase cannot be treated as net-price effect. |
| Memory-product differences | Samsung Electronics, SK hynix, Micron, SanDisk | Commodity, HBM, and eSSD mix; contract repricing; earnings duration | Separate industry averages and blended ASP from company EPS. |
| Economics of new orders | Hyosung Heavy Industries, HD Hyundai Electric, GE Vernova | New-order margins, lead times, contract conversion, and service | PPI and price per kW are not every company’s net selling price. |
| New supplier and long-term monetization | Doosan Enerbility | Quality record, risk discount, execution, and repeat service | Unit prices are undisclosed; do not pull distant earnings forward. |
| CPU, server, and GPU | Intel, AMD, Dell, HPE, NVIDIA | High-performance mix, volume, component-cost pass-through, and net margin | ASP and revenue growth alone do not prove pricing power. |
| Custom chips and connectivity | Broadcom, Marvell | Customer design wins, project returns, cost, and volume | AI-revenue growth is not price acceleration for the same product. |
| Power and cooling systems | Vertiv | Price-cost spread, delivery, and cash conversion | Verify demand growth and price growth separately. |
| Substrate product transitions | Daeduck Electronics, Simmtech, Korea Circuit | New-customer ramp, yield, mix, and cash | Earnings can improve through a new path without P acceleration. |
| Biopharma, ODM, and shipbuilding | Samsung Biologics, ST Pharm, Kolmar Korea, HD Hyundai Heavy Industries | Production, utilization, contract economics, and order conversion | No evidence of continuous P acceleration does not mean no business opportunity. |
Daeduck Electronics is a candidate where production ramps for new customers and higher-value substrates may change earnings. That is a different question from whether the price for the same specification is accelerating quarter after quarter. Shipbuilding earnings can also rise as previously booked high-priced orders convert to revenue even if current newbuild prices are flat. In biopharma and ODM, volume and utilization can matter more at some points in the cycle.
Ciena is included separately among the 28 because it clearly shows both sides of price increases and procurement costs. Earlier supply-chain candidates include Doosan’s Electronic Materials business, Sakai Chemical, and AXT. Doosan’s Electronic Materials business and Doosan Enerbility are different companies and businesses. For these candidates, net price after removing product mix and raw-material pass-through needs more work.
Key-material suppliers such as Nitto Boseki and Ajinomoto also show why a shortage alone does not confirm a company’s willingness to exercise pricing power. Customer relationships and capacity-expansion plans may lead suppliers to avoid further increases. The point of this integrated review is not to expand the list of famous bottlenecks, but to demand evidence that fits each company’s path to earnings.
A 30% rise in EPS with a 25% P/E decline means the stock falls 2.5%
The price-to-earnings ratio (P/E) is the share price divided by earnings per share (EPS). Holding the earnings definition constant, the share-price change can be decomposed as follows:
Share-price change = (1 + EPS change) × (Future P/E ÷ Current P/E) − 1
If EPS rises 30% and P/E falls 25%, then 1.30×0.75−1=−2.5%. A 20% rise in EPS with a 20% P/E decline also means −4.0%. If EPS and P/E both rise 20%, the combined gain is +44%. The figure shows these combinations.
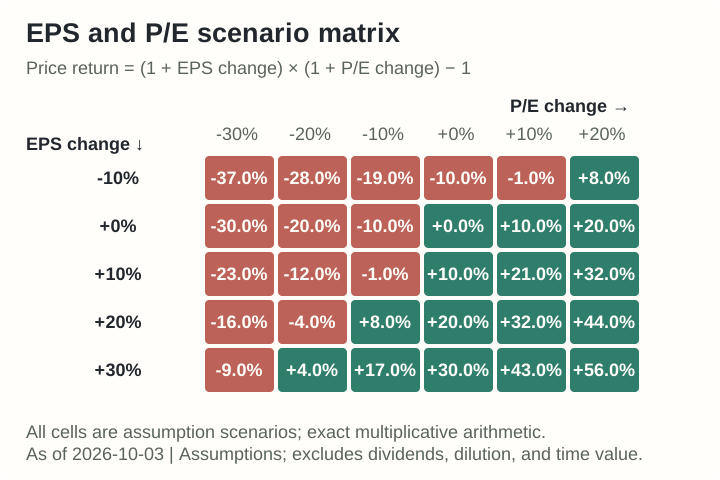
The interactive tool lets readers change both inputs and check the same calculation. It does not automatically estimate a company’s earnings outlook or fair multiple.
Samsung Electro-Mechanics’ daily closing-price record for October 2 is KRW 1,581,000. Holding EPS at an illustrative KRW 42,800 gives a P/E of about 36.94×. At the same EPS, 40× implies KRW 1.712 million and 45× implies KRW 1.926 million. The 40–45× range is an analytical assumption, not a fair value confirmed by the contract announcements.30
If EPS alone rises 20% and the multiple is unchanged, the share price rises arithmetically by 20%. That is not multiple expansion. If EPS rises 20% and the P/E reaches 45×, the price would be about KRW 2.311 million, or +46.2%. The two necessary conditions should not be presented as one positive catalyst.
Multiples also require consistent fiscal years. FY2027 adjusted EPS, next-twelve-month EPS, and trailing-twelve-month GAAP EPS are different denominators. U.S. and Korean accounting and adjustment items differ as well. Calling a stock cheap because one number is low can overlook the duration of growth and recurring costs.
Nor does a decline from a peak or distance from an average target prove the opportunity is “unpriced.” Targets can be stale, while earnings estimates and valuation assumptions can change together. A large decline shows that expectations fell; new earnings and cash must establish whether that fall was excessive.
The strongest counterargument is that high prices can reduce customer spending
The first counterargument is end demand. If memory, power, and optical-networking prices all rise at once, the cost of one unit of AI infrastructure rises too. Revenue across suppliers cannot be added as if each supplier had independent end demand. The same customer’s capital budget appears at several points in the supply chain.
Customers can lower specifications, delay delivery, qualify substitutes, reduce storage per system, or design for lower power consumption. High prices create an opportunity for suppliers and signal a potential demand response. If price increases that benefit producers delay system installations, order conversion may also be delayed.
The second counterargument is competing supply. Toshiba’s first shipment, substrate expansions, and optical-component yield improvements can ease shortages. Customer certification, raw materials, and staffing can delay the effect between an announcement and full production. But marginal supply can pressure prices even when the competitor still has a small market share.
The third is the two-sided nature of long-term contracts. A volume floor helps, but a price ceiling may bind. An advance provides funding but is not unrestricted cash. Check whether recurring contracts actually reduce risk or lock in future delivery obligations at low prices.
The fourth is discount rates and market expectations. On October 2, the BLS reported 29,000 new nonfarm jobs in September and an unemployment rate of 4.2%. Weak employment does not automatically guarantee lower long-term rates or higher equity multiples. Changes in rates, risk premiums, and foreign exchange also change the present value of earnings several years out. This article does not use live market yields or a precise U.S. 10-year yield as a confirmed model input.31
These counterarguments are not decorative reasons to reject AI demand. They are actual variables determining when, where, and how much of a price increase remains as profit. Only after a bullish case survives them can it support a higher multiple.
At the next results, ask how much of the price increase remained as profit
Confirm exact earnings-release dates in company IR announcements. Unconfirmed dates have not been entered as fixed dates in an investment calendar. The next quarter and FY2027 outlook should be checked against the following items.
| Company or group | What to check next | What would strengthen the case | What would rebut it or defer an upgrade |
|---|---|---|---|
| Samsung Electro-Mechanics | Direct-customer price realization, component profitability, and support terms | Net-price contribution and cash after investment exceed existing expectations | Costs, discounts, or depreciation absorb the increase; support terms are unfavorable |
| Seagate and WDC | Price per unit of capacity, contract repricing, HAMR, and competitor qualification | High unit profit and cash persist despite new supply | Lower repricing, diversified customer sourcing, or higher yield costs |
| Ciena | Gross-margin explanation for price, mix, and costs; cash conversion | Secured supply enables shipments and increases remain in net margin | Supplier advances or inventory rise, customer concentration, delivery delays, or discounts |
| Hyosung and HD Hyundai Electric | Economics of new orders and conversion of existing orders to revenue | High-margin contract mix and cash collection improve together | Mix effects stall or tariff, cost, and delivery expenses pressure earnings |
| GE Vernova | Conversion of slot reservations to orders, model mix, and service | Strong order economics convert into deliveries and recurring service | Reservations convert slowly; new prices or margins fall after capacity expansion |
| Doosan Enerbility | Delivery, validation, service wins, and investment recovery | Evidence accumulates of a lower risk discount and recurring earnings | Contract execution is delayed, first-of-a-kind costs rise, or distant earnings are overvalued |
| Four memory suppliers | Product-level contract prices, mix, cash, and contract terms | Sustained high prices and product transitions lift the earnings floor | Industry outlook diverges from realized prices; costs, volumes, or contract ceilings bind |
The priority research areas are Samsung Electro-Mechanics’ direct-customer repricing and returns on capital; Seagate’s technology, cash generation, and competing supply; and Ciena’s price increases and procurement costs. For power equipment, track the economics of long-duration orders and service. For memory, track product-level prices and contract durability. This is a research sequence for testing different failure risks, not a confirmed buy ranking.
After checking whether bottleneck prices are rising further, look for earnings that remain even when they fall. Companies that use contracts, technology, and cash recovery to extend the life of high earnings may warrant a re-rating. Then calculate whether today’s share price already includes that outcome.
Sources and limits of the calculations
Company results, filings, and industry releases were compared as of October 3, 2026. Call transcripts are evidence of management statements, not substitutes for full contract terms. Where no same-specification price series was available, margin and revenue were not used as replacements for price itself. Assumed multiples, earnings-retention rates, diluted share counts, and scenarios are not factual values.
Disclaimer: This material is for research and information only. Companies, multiples, and scenarios are analytical examples. Readers should make investment decisions only after their own review.
Seagate FY2026 Q4 and full-year official results, released July 28, 2026; quarter ended July 3, 2026. ↩︎ ↩︎
STX daily share prices, October 2, 2026 regular-session close of $848.99, down 10.21%. This is not a dividend-inclusive total return. ↩︎ ↩︎
Toshiba first shipment from expanded Philippine line and production-capacity target, company announcement dated October 2, 2026. Measured by its own storage capacity. ↩︎ ↩︎
Ciena official FY2026 Q3 results, released September 3, 2026; quarter ended August 1, 2026. ↩︎ ↩︎
CIEN daily share prices, comparison of the October 2, 2026 close with the June 3, 2026 intraday high. EPS of $12 is an analytical assumption in the article. ↩︎ ↩︎
TrendForce Q4 2026 memory outlook, September 30, 2026. The article was compared with the Q3E and Q4F table in the same release. ↩︎ ↩︎ ↩︎
TrendForce Q3 2026 memory outlook, July 3, 2026. Distinguish this from the updated Q3 estimate in the September release. ↩︎
TrendForce 2027 blended HBM ASP outlook, September 29, 2026. This is not a company-specific confirmed price or a same-generation price index. ↩︎ ↩︎
TrendForce forecast for Samsung Electro-Mechanics’ Q4 2026 OEM/ODM price increases, August 27, 2026. Actual application rates depend on customer negotiations. ↩︎
Samsung Electro-Mechanics 2026 half-year report, August 14, 2026. ASP, average input prices, and the reporting period were checked in the OpenDART filing. ↩︎
Samsung Electro-Mechanics official Q2 FY2026 results, July 30, 2026. Segment-revenue shares are calculated from disclosed values. ↩︎
Samsung Electro-Mechanics’ KRW 6.78 trillion Sejong and Vietnam investment and customer support, company announcement dated September 29, 2026. See also the Sejong investment filing and Vietnam asset-acquisition filing, both dated September 28, 2026. Filing investment periods and planned production or operating dates differ. ↩︎
Samsung Electro-Mechanics MLCC and inductor supply agreement, September 29, 2026. No contract deposit or advance payment. The contract amount is shown in Korean won after applying exchange rates. ↩︎
Samsung Electro-Mechanics Q2 FY2026 IR financial statements, cash-flow appendix. Simple residual cash = CFO − purchases of property, plant, equipment, and intangible assets. ↩︎
Seagate corrected FY2026 Q4 earnings-call transcript posted on its IR site, call held July 28, 2026. Distinguishes the year-over-year interpretation of price per unit of capacity from management’s remarks. ↩︎ ↩︎
Lumentum official FY2026 Q4 SEC results, released August 11, 2026; quarter ended June 27, 2026. GAAP and adjusted earnings are distinguished. ↩︎ ↩︎
Republished transcript of Ciena’s FY2026 Q3 earnings call, call held September 3, 2026; Quartr transcript. Pricing, backlog, and tariff-refund commentary were checked against this transcript; the official IR transcript PDF was not directly obtained. ↩︎ ↩︎ ↩︎
Ciena Q3 FY2026 SEC 10-Q, customer concentration, debt, and supply agreements. Recurring costs and dilution should be reviewed separately. ↩︎ ↩︎ ↩︎
Ciena SEC EX-99.2 Q3 presentation, September 3, 2026. Initial FY2027 outlook and cash-flow comparison table. ↩︎ ↩︎
Ciena FY2029 financial targets, September 16, 2026. About $14.10 billion is calculated as 6.42×1.3³; it is not a separate confirmed revenue figure. ↩︎
FRED transformer-manufacturing PPI, PCU335311335311, BLS source data through August 2026. The index series and unit are fixed for the calculation. ↩︎
Korea Investment & Securities, Hyosung Heavy Industries Q2 FY2026 review, analysis of Q2 results. This is a securities-firm analysis, not a company filing on unit prices; the margin comparison is year over year. ↩︎
GE Vernova Q2 FY2026 SEC results release, July 22, 2026. ↩︎
GE Vernova official Q2 FY2026 call transcript, July 22, 2026. Distinguishes the price comparison’s base period from backlog and slot reservations. ↩︎ ↩︎
Doosan Enerbility announcement of seven U.S.-bound gas turbines, March 6, 2026; company plan. ↩︎
Doosan Enerbility KRW 480 billion long-term service agreement for three units, May 26, 2026; total contract value and commercial-operation target. ↩︎
Doosan Enerbility TerraPower equipment-manufacturing contract, August 14, 2026; company-provided announcement reported by the press. Repeat volume production revenue and margins are unconfirmed. ↩︎
Republic of Korea policy briefing on the Korea–U.S. strategic investment announcement, October 1, 2026. Distinguishes project selection, a framework agreement, and the start of a review. ↩︎
Cameco’s description of the Korea–U.S. nuclear framework, posted by Westinghouse, Cameco announcement dated September 30, 2026 and posted October 1. Terms are non-binding and remain subject to final negotiations. ↩︎
Samsung Electro-Mechanics official share-price page, using the daily-table close of KRW 1,581,000 on October 2, 2026, not the differently displayed current-price field. EPS of KRW 42,800 is a fixed assumption for the sensitivity in the article. ↩︎
BLS September 2026 employment report, released October 2, 2026. The causal relationship between employment, rates, and share prices is not assumed. ↩︎