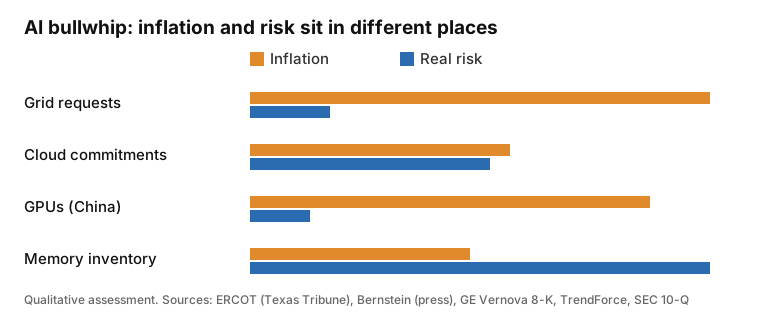
The consensus story goes like this: “The AI bubble is in grid connection requests. Requests are several times real demand, so that is where it pops.”
Half of that is right. Power requests are the most inflated number in the chain. But that inflation is already measured in public filings, and it is being filtered out. On September 29, 2026, Virginia utility Dominion told PJM, the eastern U.S. grid operator, that it had removed 19,044 MW (58.6%) of the 32,473 MW of data center requests at the early engineering stage from its own load forecast. A number that gets filtered out does not become a loss.
Our view: rank AI supply chain loss risk by “cancellation cost × cash already tied up,” not by how inflated a number looks. On that test, buyer-held, already-paid component inventory ranks first, supplier-backed multi-year cloud commitments second, and grid requests last. The ranking flips if any of the conditions in the table below shows up by the first half of 2027.
Memory inventory itself was covered yesterday in Part of the DRAM Shortage Is Inventory. Below are the power and cloud numbers, and the path by which delays in both change memory orders.
Why ranking by inflation gets it wrong
The bullwhip effect is order volatility that grows as you move upstream, because each stage reads the orders below it as demand and adds a safety margin (Lee, Padmanabhan, Whang, 1997). On top of the classic causes (duplicate requests, padded orders under allocation, buying ahead of price increases), AI adds two more. Servers are complements: GPU, CPU, memory, and power all have to be there. And suppliers backstop customer demand with their own credit.
So the same “inflation” ends differently. Turning it into a loss takes three things at once:
- Unwinding costs money (cancellation cost).
- Cash has already gone out or hit the financial statements (paid or recognized).
- The unwind lands when supply is growing (timing).
Grid requests fail both 1 and 2. Below, we put numbers on all three, stage by stage.
Power: the most inflated stage, and the one being measured and filtered
Dominion’s filing breaks down requests by contract stage (as of July 2026):
| Stage | Capacity | Nature |
|---|---|---|
| Electric service agreement (ESA) | 11,997 MW | Most firm |
| Construction letter of authorization (CLOA) | 9,356 MW | Construction stage |
| Engineering letter of authorization (ELOA) | 32,473 MW | Earliest stage |
| Total | 53,826 MW | |
| ELOA excluded from forecast | 19,044 MW | 58.6% of ELOA |
Source: Dominion PJM filing, Sept. 29, 2026, pp. 5-6.
One caveat. The 58.6% is the exclusion rate for early-stage requests only, not a “phantom rate” for all data centers. The 21,353 MW at ESA and CLOA stays in. Since September 2026, PJM also requires utilities to ask customers whether they filed the same load elsewhere (PJM, Sept. 29). PJM has not published an actual duplication rate.
The national numbers look even more inflated. ERCOT’s 2032 peak forecast of 367.8 GW is about 4.3 times its all-time record of 85.5 GW (Texas Tribune, June 17, 2026). Bernstein judges only 33-35% of the 456 GW U.S. data center power pipeline credible (as cited in press reports; we did not see the original). These numbers are large, which is exactly why regulators and utilities cut them first.
The real money in power is in equipment, not requests. GE Vernova’s 122 GW of gas turbine exposure at the end of Q3 is 64 GW of firm backlog plus 58 GW of slot reservations. In the quarter, 13 GW of reservations converted to firm orders, against 8 GW of new reservations (GE Vernova Q3 results, Oct. 28). Reservations turning into orders with deposits faster than new ones arrive means paid demand, not paper demand, is flowing into equipment.
So the number to watch in power is not “requested GW falling.” If requests fall while ESA, CLOA, and turbine conversions hold, real demand is intact. If cancellations show up at the ESA or CLOA stage, that is no longer paper being filtered. That is a loss.
Cloud: the same capacity counted three times, and the credit behind it
Cloud commitments are the largest layer by dollars. Microsoft’s and Oracle’s remaining performance obligations were reported at about $677 billion and $664 billion (press reports of company filings, secondary). The problem is structure, not size.
The same capacity gets counted more than once. Nebius’s deal with Meta pairs $12 billion of dedicated capacity with Meta’s commitment to buy up to $15 billion of capacity Nebius cannot sell to third parties (Nebius 6-K, March 16, 2026). CoreWeave’s 2025 deal with NVIDIA is a similar unsold-capacity purchase with an initial value of $6.3 billion (CoreWeave 8-K, Sept. 2025). Add third-party sales and the backstop maximum as demand and you count the same GPU twice. Add the subcontracting chain from AI lab to hyperscaler to neocloud and it is three times.
Revenue does not tell you utilization. 98% of CoreWeave’s Q2 2026 revenue came from committed contracts (CoreWeave 10-Q). Revenue paid regardless of use can hold up while GPUs sit idle.
Risk is moved, not removed. Backstops are not fraud and not fake revenue. They do mean that capacity can be built on credit from inside the supply chain before an independent end customer shows up. If usage falls short, the cost is split by contract among the lab, the backstop provider, and the lenders, not just neocloud shareholders. Anthropic’s S-1 discloses $265.6 billion of fixed and minimum purchase commitments at June 30 (terms of 1 to 20 years) against first-half revenue of $16.29 billion (Anthropic S-1, Oct. 26). Dividing one by the other and calling it “16x over-ordering” is wrong, because the two cover different time spans. What matters is the payment schedule by year and actual delivery dates.
Right now, the shortage is real. On October 28, Microsoft reported 48% Azure growth and demand exceeding supply (Microsoft earnings, Oct. 28). On September 17, CoreWeave said it signed new 3-6 month contracts at about $40 million of annualized revenue per MW of cluster power (CoreWeave, Sept. 17). High prices on short contracts show scarcity today.
So the cloud risk is not “glut now.” It is the gap between long fixed commitments and short-term market prices. Once short-term prices turn, whoever holds long commitments on the same GPU generation eats the difference. This layer ranks second rather than first for one reason: the adjustment gets spread over years through renegotiation and term extensions. A February 2026 report that OpenAI’s compute spending target through 2030 was reset from about $1.4 trillion to about $600 billion (secondary) is an example of how that works.
Memory: briefly, yesterday’s conclusion and the new link
Yesterday’s point: U.S. cloud providers’ DRAM inventory rose in Q2 2026 because of server CPU shortages (TrendForce, July 9). That inventory is already booked as supplier revenue, and it unwinds just as Intel’s server CPU supply increase arrives in the second half of 2027 and memory wafer capacity grows in 2028 (industry estimate: 15-17%).
The new numbers are on the buyer’s books. Dell’s production materials inventory rose 137%, from $6.70 billion at the end of January 2026 to $15.89 billion at the end of July (Dell 10-Q). It is not all memory, but it is parts the buyer has already paid for. On the supply side, NVIDIA’s supply and capacity commitments rose from $119 billion to $279 billion in one quarter (NVIDIA 10-Q, Note 10). Both are high cancellation cost with a lot of cash tied up.
The cross-stage path: usage can rise while orders halve
The core of this piece is the link between stages. When power and CPUs are late, buyers stock memory first. When the bottleneck clears, that stock replaces new orders. A hypothetical example for a single part (not a market estimate):
| Item | Quarter A | Quarter B |
|---|---|---|
| Actual usage (shipments) | 100 | 110 |
| Opening inventory | 20 | 60 |
| Target closing inventory | 60 | 20 |
| Orders = usage + target − opening | 140 | 70 |
Usage rose 10%. Orders fell 50%. Power delays and CPU shortages push inventory targets up, as in Quarter A. Clearing the bottleneck pulls them down, as in Quarter B. So “token usage keeps rising, so chip orders are fine” does not follow. In Ramp’s linked sample, token usage in the week ended October 23 was up 37.1% from four weeks earlier, while spending rose only 8.9% (Ramp AI Index; sample limits apply). Usage and money are already moving at different speeds.
The ranking, and what would flip it
| Rank | Stage | Cancellation cost | Cash tied up | Unwind overlaps supply growth | What would flip this rank |
|---|---|---|---|---|---|
| 1 | Buyer component and memory inventory | Already paid | Large (Dell materials +137%) | H2 2027 CPU supply + 2028 memory supply | If buyer inventory falls as CPU supply rises in H1 2027 and DRAM spot holds above contract → it was assembly backlog, not over-ordering; drops to 3 |
| 2 | Supplier-backed cloud commitments | High on paper, renegotiated in practice | Cash only for usage, rest is commitment | Spread over years | If new short-term prices for the same GPU generation fall two quarters in a row, or backstops are actually drawn → rises to 1 |
| 3 | Power generation equipment | Low for reservations, deposits for orders | Medium | 2027-2028 | If GE Vernova new reservations exceed conversions two quarters in a row and cancellations or deferrals are disclosed → rises to 2 |
| 4 | Grid connection requests | Near zero | Near zero | N/A | If cancellations hit firm stages (ESA, CLOA) → it is a loss, not paper; rises with equipment |
This ranking is our judgment, not a statistical ranking of over-order rates on a common denominator. What sets the order is the three right-hand columns, not the size of the inflation.
Counter-evidence and limits
The evidence against a broad glut is clear. Azure growth and short-term contract prices show a shortage today. On its October 15 call, TSMC said it checks demand with its customers’ customers and visits U.S. data center construction and power sites (TSMC Q3 transcript, pp. 4-5). This piece is not about “a bubble now.” It is about who cuts orders first in the next cycle.
Some things we could not measure. Cloud providers’ DRAM weeks of inventory and PJM’s actual duplication rate are not disclosed. ERCOT, Bernstein, Microsoft and Oracle obligations, and the OpenAI figure come from press reports. Anthropic figures are from its S-1 only.
What to check next
| Timing | What | Strengthens this view | Weakens it |
|---|---|---|---|
| Mid-Nov | NVIDIA October quarter | Supply commitments outgrow revenue | Commitments slow, inventory falls |
| Late Nov | Dell Q3 10-Q | Materials inventory outgrows revenue | Inventory falls while revenue rises |
| Nov-Dec | PJM 2027 load forecast | More early-stage exclusions, firm stages intact | Cancellations at ESA or CLOA |
| Next quarter | CoreWeave, Nebius results | Short-term prices fall, backstops drawn | Independent third-party usage rises |
| Mid-Dec | Micron November quarter | Customer inventory comments plus supplier inventory rebound | Customer inventory falling |
| Late Jan 2027 | GE Vernova Q4 | (Power rank rises) new reservations > conversions | Conversions stay above new reservations |
Which cell in this ranking do you think flips first? If you have a number we are missing, tell us in the comments.
Key sources
- Dominion Energy, PJM filing, Sept. 29, 2026
- PJM, large load vetting process, Sept. 29, 2026
- GE Vernova Q3 results, Oct. 28, 2026
- Nebius 6-K, March 16, 2026
- CoreWeave 8-K, Sept. 15, 2025 · 10-Q, Q2 2026 · Short-term contracts, Sept. 17
- Anthropic S-1, Oct. 26, 2026
- NVIDIA 10-Q, July 26, 2026 · Dell 10-Q, July 31, 2026
- Microsoft FY27 Q1 earnings, Oct. 28 · TSMC Q3 transcript, Oct. 15
- TrendForce, U.S. cloud DRAM inventory, July 9, 2026 · Ramp AI Index
- Texas Tribune, ERCOT large loads, June 17, 2026 · OpenAI compute spending report (secondary)
- KII, Part of the DRAM Shortage Is Inventory, Oct. 30, 2026
This analysis is based on public information and is not investment advice.