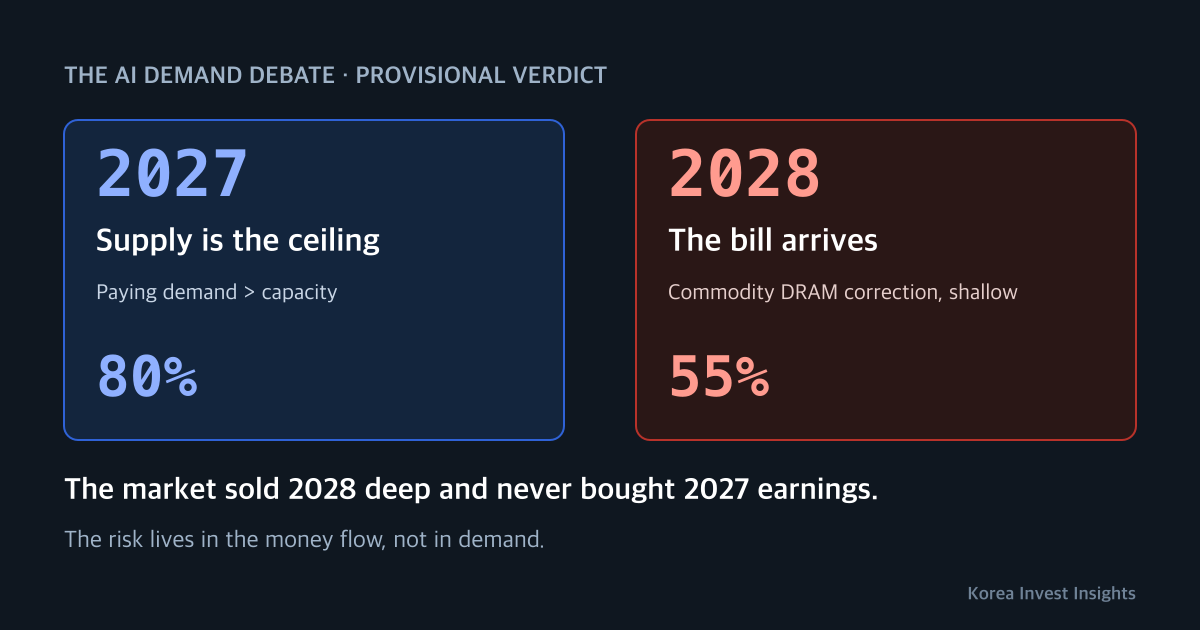
The market’s story is short: “AI demand is rolling over. That is why SK hynix is down 51% from its high.”
We take the other side. Over the past two weeks this series asked the same question from several angles: part of the DRAM shortage is buyer inventory, the AI bullwhip map, AI ROI clears the bar through volume and other ledgers, the market sold the shelf life of supplier profits, and what Samsung’s 3x multiple prices into 2028. Today we tie those pieces into one call. It is provisional, and the conditions that would flip it are listed with dates.
Our view: In 2027, AI compute demand exceeds supply, and it stays that way all year. Supply, not demand, sets the 2027 token count. So “demand slowdown” is not the 2027 risk. The risk sits where the money flows. Token prices fall 45-55% a year while compute rents hold. That squeeze lands on labs that rent their compute, and the real variable is whether it travels through finance into 2028 orders. The bullwhip is real but small. It sits in buyers’ commodity DRAM buffers, and its bill comes in 2028. Because the supply chain is behaving conservatively, a 2028 commodity DRAM correction is coming, but it will be shallower than what the market has priced. The market sold 2028 deep and has not bought any of 2027’s earnings.
- We put 80% odds on paying demand exceeding capacity for all of 2027. Flat growth, announced list-price hikes and sold-out capacity are the shape of a ceiling.
- The odds that 2027 memory profits break through the demand path are 10% or less. The odds that the finance path cuts 2027 shipments are 15% or less. The squeeze lands on 2028 orders.
- Non-repeating buyer-buffer demand is 8-13% of 2027 shipments. Moved into 2028 demand, it is about 10%, one scenario notch.
- We put 55% odds on a 2028-29 commodity DRAM correction. Because the big four memory makers add only 15-17% more wafers in 2028, we expect it to be shallow.
The reference date is November 1, 2026. All probabilities are our subjective estimates. We move them only in 5-point steps, and only on a primary source or a threshold break.
The numbers draw a ceiling, not fatigue
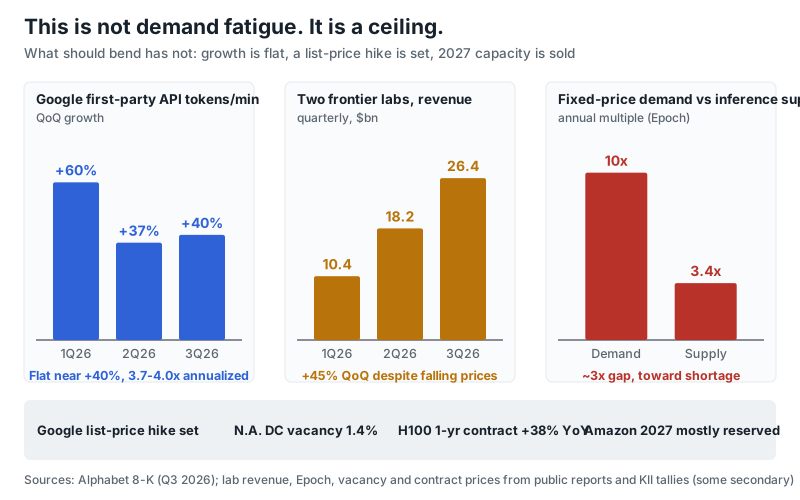
In a market with tiring demand, quarterly growth keeps slowing and prices and bookings fall with it. Every current number points the other way.
| Indicator | Value | How to read it |
|---|---|---|
| Google first-party API tokens per minute, QoQ | Q1 2026 +60%, Q2 +37%, Q3 +40%. Two quarters annualized: 3.7-4.0x | It stepped down once and then flattened. It is not bending every quarter |
| Google API list prices | Hike announced (effective Dec 1 and Jan 1, 2027) | Demand fatigue would push prices down. They are going up |
| Two frontier labs, combined quarterly revenue | Q1 2026 $10.4bn, Q2 $18.2bn, Q3 $26.4bn | +45% QoQ despite falling unit prices |
| Amazon Bedrock tokens (YoY), Microsoft Foundry | 17x, 5x | Wherever capacity frees up, it fills |
| North American DC vacancy, H100 one-year contract price | 1.4%, +38% YoY | The scarce thing is energized GW |
| Amazon 2027 capacity | Mostly booked; a sizable share of 2028 too | 2027 is already sold |
| Epoch: fixed-price demand vs inference supply | About 10x vs 3.4x a year | A ~3x gap, toward shortage |
Google’s token growth is flat near +40%. Over the same stretch Google announced list-price hikes and Amazon closed out 2027. That combination is the shape of a supply curve, not a demand curve. The Q3 token figure is in Alphabet’s earnings release (Alphabet 8-K, Q3 2026).
Anthropic’s second quarter showed the same thing. When capacity freed up, pent-up demand appeared at once. We used Anthropic’s Claude for research and editing, so we carry Anthropic’s numbers as reported and do not judge their impact.
Solve 2027 token volume with the supply formula
When demand is pinned against a ceiling, demand surveys cannot tell you 2027 volume. The supply formula can. Multiply supply GW growth of 40-50% a year by Nvidia Rubin’s realized efficiency.
If Rubin delivers 5-7x Blackwell on real workloads, hardware alone gives 2.5-3.1x the 2026 level. Add 1.3x from software and the ceiling is 3.3-4.0x. Our previous base range of 2.5-3.0x sat at the bottom of that ceiling. We move the base to 2.8-3.3x. That range is GW +45% times 1.9-2.3x tokens per GW. Because volume is supply-bound, GW demand is also near the same +45%.
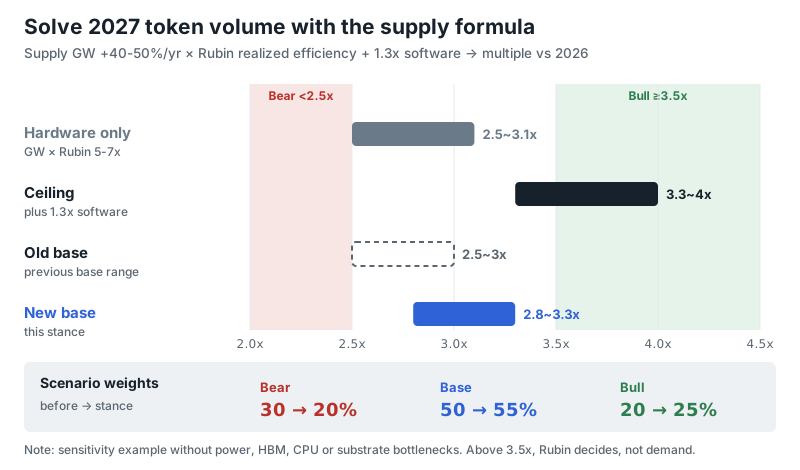
Demand does not decide anything above 3.5x. Rubin does. That is why the bull case struggles to go above 20-25% no matter how strong demand is. A result below 2.5x has two routes. One is demand breaking. The other is smaller throughput from a Rubin delay, weak realized efficiency, or power and substrate bottlenecks. In that second case unit prices and rents hold, which is the opposite signal from weak demand. There is no evidence that demand has broken, so we cut the bear case from 30% to 20%. We track the supply route separately through measured Rubin efficiency and power.
One condition withdraws this call. If Alphabet’s Q4 API tokens per minute grow less than 15% QoQ, the problem is demand, not price, and that number alone is enough. If token volume in corporate spend samples like Ramp shrinks, we review; three months of no growth plus another drop in the top 1% sends us back to the previous base. The first check is the Ramp data on November 13. The decisive check is Alphabet’s results in early February 2027.
The risk lives where the money flows
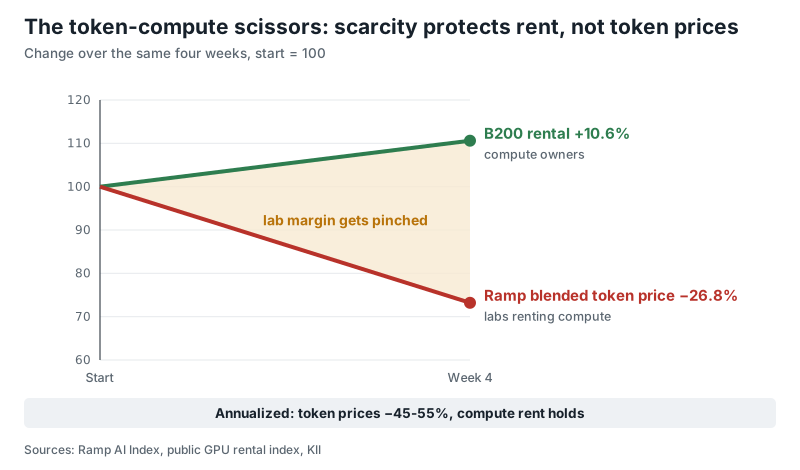
Demand can grow without money growing at the same rate. We call this the token-compute scissors. Over the same four weeks, the blended token price in corporate card data fell 26.8% and Nvidia B200 rental rates rose 10.6%.
| Variable | Value |
|---|---|
| Ramp blended token price, 4 weeks | −26.8% |
| B200 rental, same period | +10.6% |
| 2027 lab revenue (4Q27/4Q26, previous base of 2.5-3.0x volume) | +40-80% |
| 2027 GW demand (previous base) | +25-90%, center +53% |
| Lab revenue at the new 2.8-3.3x base and unit prices −40-45% | +54-98% |
| GW demand at 2.8x Rubin efficiency and 4.2x volume | +50% |
| Lab revenue per GW under the same conditions | +12-40% |
Compute scarcity protects rental rates. It does not protect token prices, because labs chase volume with cheap tiers. So the squeeze hits the margins of labs that rent compute before it hits hyperscalers that own it.
If lab funding stalls, the backlog that leans on labs wobbles. Oracle’s prepayments, the OpenAI share of Microsoft’s and Oracle’s backlog, and the neoclouds sit there. Neocloud and developer problems reach hyperscaler balance sheets through guarantees: Alphabet’s $48 billion data center payment guarantees and Meta’s $41.5 billion residual value guarantees.
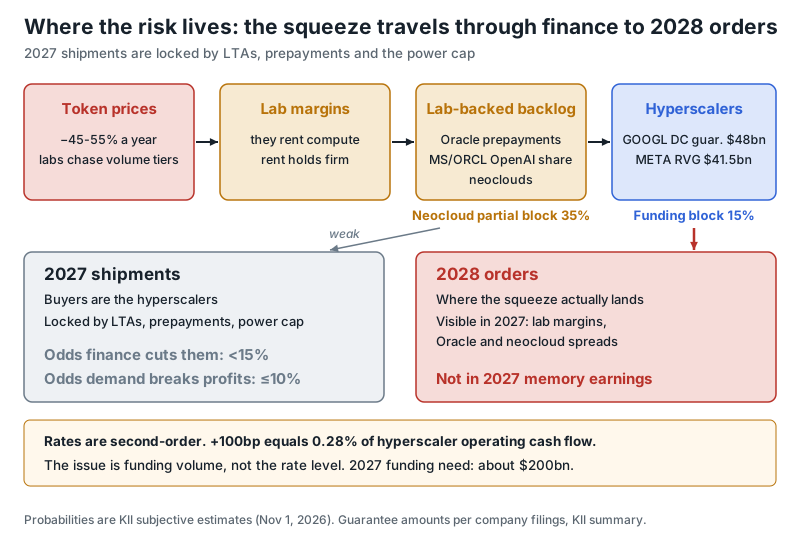
We put 15% odds on hyperscaler funding stalling and 35% on neoclouds being partly blocked. This path can arrive inside 2027. LTAs carry price bands, volume-cut and undelivered-volume termination clauses, and SK hynix’s contracts cover more than 50% of 2027-28 capacity, not all of it. Still, hyperscalers are the ones buying 2027 shipments, and prepayments and the power cap tie up volume. So this path mainly cuts 2028 orders rather than 2027 shipments. How firmly volume is locked follows the counterparty’s cash ranking: hyperscalers first, then labs, then neoclouds.
More tokens do not mean proportionally more memory bits
Here is the paradox. Even if tokens grow faster than expected, GW and memory bits do not grow at the same rate. At 4.2x token volume, GW demand is +50%, the same as the center of the base case. What rises is lab revenue per GW.
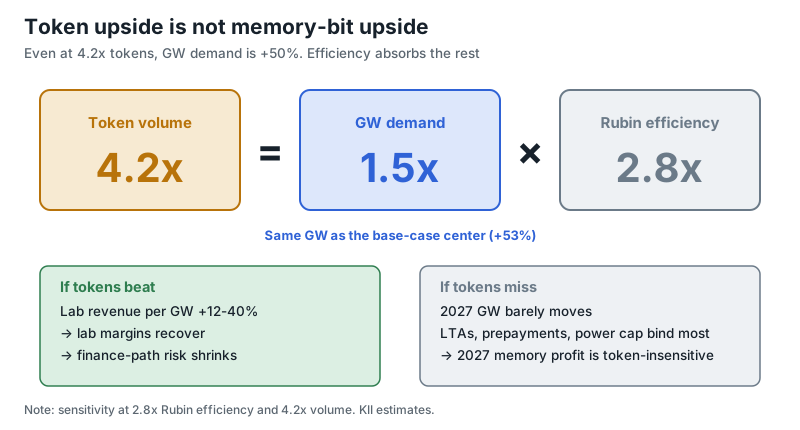
So token upside does not arrive as memory-bit upside. It arrives as recovering lab margins, and it shrinks the finance-path risk. In reverse, token downside cannot cut 2027 GW by much either, because most 2027 volume is tied up by long-term agreements (LTAs), prepayments and the power cap. 2027 memory profit is insensitive to the token count. That is the precise meaning of “2027 is locked.”
So here is where we stand. The odds that 2027 memory profits break through the demand path are 10% or less. The odds that the finance path cuts 2027 shipments are 15% or less. In 2027, the squeeze will show up in lab margins and in Oracle and neocloud spreads, not in memory earnings.
Rates are second-order. A 100bp rise costs hyperscalers 0.28% of operating cash flow. The issue is funding volume, not the rate level. The 2027 funding need is about $200 billion. As our same-day Ackman post showed, Big Tech’s combined Q3 free cash flow is already negative. The marginal AI dollar is debt, and the variable is whether that debt gets funded on time.
The bullwhip is small, and it sits in buyers’ commodity DRAM
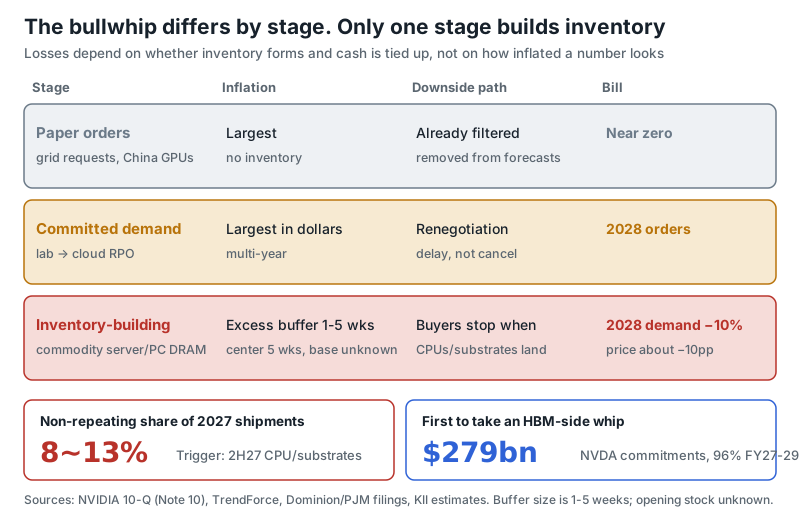
The bullwhip has a different character at each stage. Paper orders are largest in grid connection requests and Chinese GPU orders. But they build no inventory, and forecasts already filter them out (AI bullwhip map). Committed forward demand is largest in multi-year lab-to-cloud commitments (RPO). Its downside path is renegotiation, not cancellation.
The bullwhip that builds inventory is in memory, specifically buyers’ buffers of commodity server and PC DRAM. The cause is the server CPU shortage. Without CPUs, buyers cannot build servers, yet they bought DRAM first (part of the DRAM shortage is inventory).
| Item | Value |
|---|---|
| Buyer DRAM buffer, excess over normal | 1-5 weeks estimated (cumulative shipments minus installs 2-9 weeks, center 5; end-2025 opening stock unconfirmed) |
| Non-repeating buffer demand in 2027 shipments | About 8-13% |
| Share of 2028 demand taken by a 5-week excess buffer | About 10%. One scenario notch, about 10 points of price |
| Threshold for a deep correction | Excess buffer of 8-12 weeks at end-2027, 2028 orders down 15-23% |
| Trigger for unwinding | 2H27 server CPU and substrate supply additions |
| First to take an HBM-side whip | Nvidia supply commitments of $279bn, 96% in FY27-29 (NVIDIA 10-Q, Note 10) |
It is small, and we know where it sits. The 2027 profit figure does not change. The bill comes in 2028, and its size is about the difference between a balanced 2028 and a mildly oversupplied one.
A conservative supply chain keeps the 2028 correction shallow
The big four memory makers grow 2028 wafers by 15-17%. Samsung runs five-year rolling LTAs, SK hynix typically five years, and the three makers’ $38 billion of prepayments stretch to 2030 (LTAs lock in volume, not profit).
The 38% drop in the equipment basket discounts lower equipment orders in 2027-28. If that is the main cause, 2028 supply is more disciplined than the market fears. HBM is only about 10% of DRAM revenue at all three makers (estimates: SK hynix 13-14%, Samsung 11-12%, Micron 7-10%), so they ration capacity like commodity-cycle companies.
Power points the same way. The US can build at most 30-40GW of data centers a year. Transformers are about 15% short. Gas turbines ordered today deliver in 2029-31. So 2027 supply cannot grow beyond the build-out already set (GW +40-50%), and extra supply arrives only modestly in 2028.
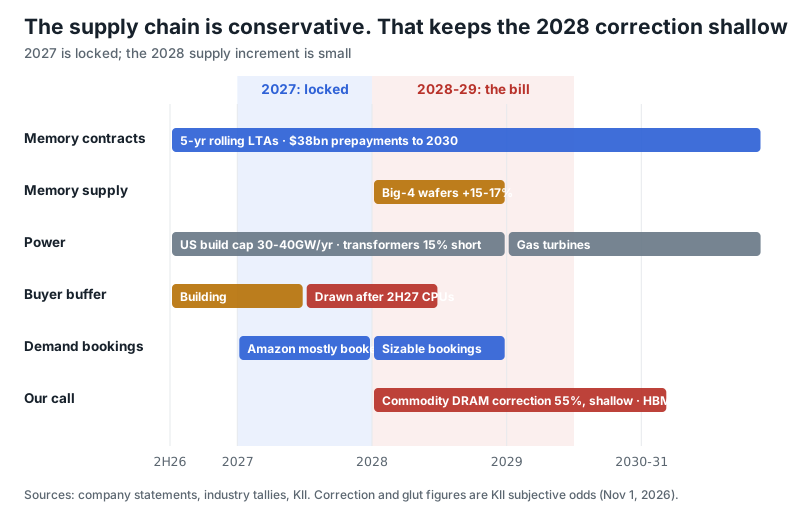
Here is how we see 2028. A commodity DRAM correction is coming; we put the cumulative 2028-29 odds at 55%. If CPUs and substrates arrive in 2H27, buffer building stops and installs absorb the stock, it will not be a deep 2021-22-style correction, because the supply increment is small and volume is tied up by prepayments and LTAs.
The shallow call is conditional. In 2021 the excess buffer was 3-7 weeks, which overlaps today’s 1-5 week estimate. If the excess buffer reaches 8-12 weeks by end-2027, 2028 orders fall 15-23%, a collapse-level cut. The threshold is buyer inventory days rising all through 2027 and not turning in 2H27.
We put the odds of an HBM glut at 20%. Samsung, with its larger commodity share, is more exposed. The first signal is mobile DRAM contract prices.
The market sold 2028 deep and bought none of 2027
This is where the market is wrong. From September 21 to October 30, about 83% of foreign net selling in Taiwan was AI hardware. Financials, telecoms and steel were not sold. What got sold was the shelf life of supplier profits, not AI demand (our November 1 post).
Prices make it sharper. Samsung trades at 3.1x 2027 expected earnings. Plug in a normal 8x multiple, and the price assumes 2028 earnings about 60% below 2027 (the Samsung 3x post). Almost none of 2026-27’s earnings are in the price; 2028 is priced deep. The 2028 we see is shallower.
Reading the drops in Intel and Chinese AI stocks as a demand slowdown today is not supported by current demand data. The gate to the demand-slowdown scenario (S3) is a single one: hyperscalers slowing capex. On their Q3 calls, all four raised 2027 capex. Amazon called 2027 a “meaningful increase,” and Meta even turned to equity financing. Prices alone cannot rule out that the market is pricing a future demand slowdown starting with suppliers. The tell is the order in which equipment and memory relative strength turn.
Our call rests on 2027 earnings that are not in the price. The fastest way that gap closes is through flows, not fundamentals. Deleveraging is at the start of stage 4 of 6, and forced selling by leveraged retail investors is still ahead. That means one more shakeout before the bottom is possible.
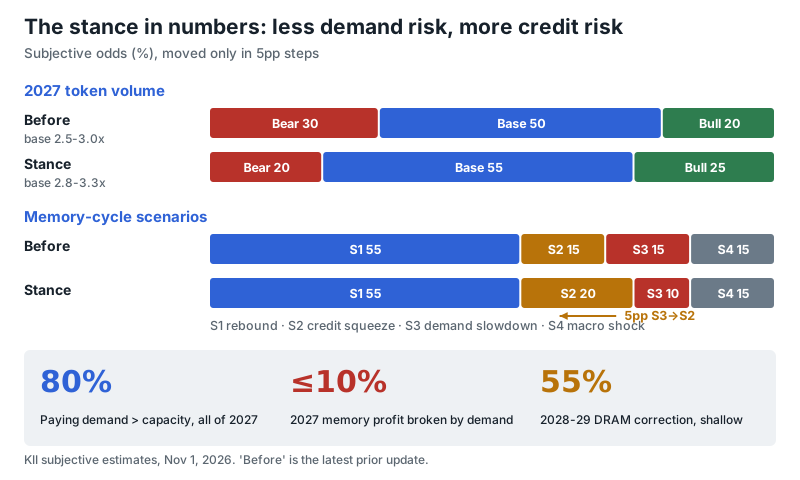
The stance in numbers: less demand risk, more credit risk
| Call | Previous | This stance |
|---|---|---|
| 2027 token volume | Bull 20 / base 50 / bear 30, base 2.5-3.0x | Bull 25 / base 55 / bear 20, base 2.8-3.3x |
| Memory-cycle scenarios | S1 55 / S2 15 / S3 15 / S4 15 | S1 55 / S2 20 / S3 10 / S4 15 |
| Paying demand exceeds capacity all of 2027 | New | 80% |
| 2027 memory profits break via demand | New | 10% or less |
| 2028-29 commodity DRAM correction | 2028 45%, cumulative 55% | Cumulative 55%, shallow |
| Character of the bullwhip | Temporary 35 / structural 50 / negligible 15 | Unchanged, leaning structural |
The scenario names follow our October 24 post: S1 rebound, S2 credit squeeze, S3 demand slowdown, S4 macro shock.
Moving 5 points from S3 to S2 has one meaning: we move the risk’s address from demand to credit. After Amazon’s results we also weighed raising S2 to 35%, but we kept the move smaller. The company borrowing cash fastest is also the one with the longest booked backlog, and we give those two facts equal weight.
Answering the obvious objections first
“People use tokens because they got cheap. That is not real demand." Cheap tokens did pull in demand. That is exactly why we put the risk in the money flow. But demand that rests only on price would give Google no reason to announce list-price hikes. In quarters when unit prices fell, volume still grew 40% and lab revenue grew 45%.
“Intel and Chinese AI stocks fell. Demand is cooling." The gate that decides a demand slowdown is hyperscalers’ 2027 capex. All four raised it in Q3. While that gate is shut, drops in peripheral stocks are explained by flows and discount rates.
“If Rubin is 7x more efficient, there will be spare GW." Higher efficiency raises the ceiling on 2027 token volume. It does not leave GW idle. 2027 GW is already tied up by LTAs and the power cap, and paying demand fills it. If Rubin stays at 2-4x, volume comes in smaller and unit prices hold. Either way, 2027 memory profits barely move.
“When the bullwhip snaps, it will be as deep as 2021-22." What differs is supply’s hands. 2028 wafer growth is 15-17%, and volume is tied up in prepayments and LTAs. A 5-week excess buffer takes about 10% of 2028 demand. That is one scenario notch, not a whole cycle. We also wrote down when this answer fails: an excess buffer of 8-12 weeks by end-2027 means a deep correction.
What would flip this call
| Area | Signal | Threshold | When |
|---|---|---|---|
| Demand | Alphabet API tokens per minute, QoQ | Under +15% means a demand problem. Under +30% means review a lower base range. +40% or more for two quarters confirms a higher range | Early Feb 2027 |
| Demand | Token volume and spend in samples like Ramp | Volume +20% a month plus a spend rebound locks in the 25% bull case. Three months of no growth plus another drop in the top 1% restores the bear case | Nov 13 |
| Finance | High-yield spread, Oracle CDS, CoreWeave bonds | 350bp+, 300bp+ and below 75 cents together mean a shift to S2 | Early-November issuance window; CoreWeave Nov 11 |
| Finance | Two labs’ combined quarterly revenue, QoQ | Below +9% for two straight quarters means the 2030 payback path breaks | Every quarter in 2027 |
| Supply | Rubin customer-measured tokens per MW | 5x or more raises the volume ceiling. Stuck at 2-4x means smaller 2027 volume and firm unit prices | Nov 19 earnings is the starting point; independent checks in 1H27 |
| Bullwhip | Rising buyer DRAM inventory days, falling same-generation rents, slowing follow-on orders | All three together move 2028 correction depth from “shallow” to “moderate” | Quarterly |
| 2028 | Mobile DRAM contract prices, 2028 HBM specs | A turn to falling contract prices pulls the commodity correction forward | Late-October contract prices onward; Nov 19 specs |
Limits and interests
Google’s mid-2025 monthly tokens, Microsoft Foundry, OpenRouter charts and Anthropic’s listing-document figures are secondary reports. Token definitions differ by metric. The capacity formula is a sensitivity example that leaves out power, HBM, CPU and substrate bottlenecks. The equipment drawdown mixes China exposure and position liquidation, so we do not read all of it as supply discipline. Without the end-2025 opening inventory, we cannot yet tell whether the buyer buffer is one week or five.
Do you think demand or supply sets the 2027 ceiling? Which number will shake this call first, the November 13 Ramp data or Alphabet’s token growth in February 2027? Tell us why.
For research and information only. Not investment advice. Probabilities and scenarios are analytical assumptions, not trading instructions or individual portfolio decisions. Figures carry reference dates, and some come from public reports and secondary tallies. We used Anthropic’s Claude for research and editing. Anthropic appears in the AI demand chain discussed here as a customer and a compute buyer.