At the October 30 close, the S&P 500 was 3.1% below its high. That is not even a textbook correction (-10%). On the same day, the KOSPI was 37.1% below its June high, Samsung Electronics 37.9%, and SK hynix 51.4%. Applied Materials (AMAT), the chip equipment maker, was down 46.0%.
Earnings moved the other way. Samsung Electronics earned KRW 107.4 trillion of operating profit in the third quarter, and SK hynix ran an 80% operating margin. TrendForce expects conventional DRAM contract prices to rise another 10-15% in the fourth quarter (TrendForce, September 30). Between October 1 and 23, 2027 EPS estimates rose 0.7% for Samsung and 2.0% for SK hynix.
Earnings are rising, yet the stocks fell by bear-market size. So the question is simple. Is this a passing correction, or the entrance to a structural bear market that ends the AI investment cycle?
Our view: this drop comes from a higher price of money (rates and funding costs) and from large investors unwinding positions. The market did not sell today’s AI demand. It sold the belief that the high prices memory and equipment makers receive now will still hold in 2028. US indexes are in a correction, and Korean memory has already paid for a cyclical bear market. Of the switches that would make this a structural bear market, none was on as of November 1. If two switches from different groups turn on together, this view is wrong.
The reference date is November 1, 2026. Prices are October 30 closes (Yahoo Finance daily data, local currency). Foreign flows cover September 21 to October 30. Credit spreads are FRED values for October 29, and US short interest is the FINRA October 15 settlement.
The same “market” is in two different phases
“Is this a correction?” has a different answer depending on which market you mean. US large-cap indexes peaked on October 6 and are still above their 200-day moving averages. Chips and Korea peaked in late June and are already far past the bear-market line (-20%).
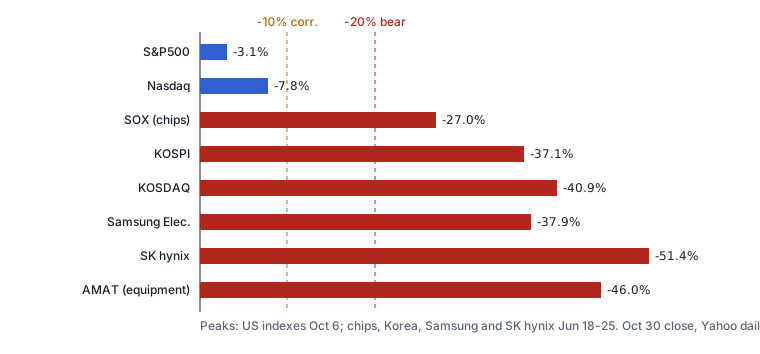
| Index or stock | 2026 high (date) | From high | Low after high (date) | Bounce from low | Vs 200-day MA |
|---|---|---|---|---|---|
| S&P 500 | 7,818.93 (10/6) | -3.1% | 7,580.07 (10/30) | 0.0% | +3.7% |
| Nasdaq Composite | 27,599.79 (10/6) | -7.8% | 25,437.00 (10/30) | 0.0% | +1.5% |
| Philadelphia Semiconductor (SOX) | 14,634.72 (6/22) | -27.0% | 10,447.49 (7/29) | +2.3% | -0.9% |
| KOSPI | 9,114.55 (6/22) | -37.1% | 5,469.47 (10/26) | +4.8% | -11.7% |
| KOSDAQ | 1,226.18 (4/27) | -40.9% | 644.78 (7/30) | +12.3% | -25.5% |
| Samsung Electronics | KRW 362,500 (6/18) | -37.9% | KRW 207,000 (7/30) | +8.7% | -5.2% |
| SK hynix | KRW 2,919,000 (6/22) | -51.4% | KRW 1,223,000 (10/20) | +15.9% | -5.0% |
The KOSPI fell 16.2% in October alone. On October 30 it dropped 3.48%, and foreigners sold KRW 1.6 trillion that day (Seoul Economic Daily, October 30). Only 17.5% of Korean stocks trade above their 50-day average, and 15.6% above their 200-day average. By the numbers, Korea is in the middle of a bear market.
So the question needs two parts. For the US, we ask whether the correction spreads into a bear market. For Korea, we ask whether the bear market that already came ends in one cycle, as in 2018-19, or drags on, as in 2022.
The layers pushing prices now are the price of money and the unwind
Chip stocks are priced by four layers at once: earnings, long-run supply and demand, the price of money, and positioning. Which layer moves prices now separates a correction from a structural bear market.
| Layer | What it asks | State now | How much is priced in |
|---|---|---|---|
| A. 2026-27 earnings | How much will memory earn this year and next? | Strong. Q4 contract prices seen higher, 2027 estimates up, 2027 HBM sold out | Barely |
| B. Supply and demand after 2028 | Do high prices survive new capacity and China’s CXMT? | Uncertain. Big-4 wafers +15-17%, CXMT share 7.6% to 9.5% | Heavily |
| C. Price of money (rates, funding) | How expensive do rates and credit make investment? | Worsening. Fed hiking cycle, 10-year at 5%, hyperscaler cash burn | Partly |
| D. Positioning | Who is selling, and how much is left? | Institutional longs mostly unwound, shorts crowded in ETFs | Largely |
The pressure on chips now comes from layers C and D. Company earnings are growing, but money got more expensive and large investors cut positions. A drop like this ends when rate pressure and the unwind stop. A structural bear market starts when the layer A earnings outlook turns, and that signal has not appeared.
Stock prices, however, move before earnings. Strong layer A earnings cannot rule out a structural bear market. They only lower its odds. This point comes back in the historical comparison below.
The test is one question: does the pressure in layer C spread into layer B? If higher capital costs make hyperscalers cut 2027-28 capex, the decline turns structural. As of November 1, Alphabet and Amazon kept their 2027 growth plans, and Microsoft trimmed its 2026 plan slightly (CNBC, October 29).
Why stocks fall while earnings rise: the up loop and the down loop
AI investment heated the economy, and the hot economy pushed rates up. When rates rise, investors turn cautious even if companies are fine. Korean macro commentator Oh Geon-young describes it as a shift from a time when money was abundant to a time when money is scarce. When money is scarce, investors pick and choose. The bottom of the profitability ladder (neoclouds, equipment, commodity memory) is sold first.
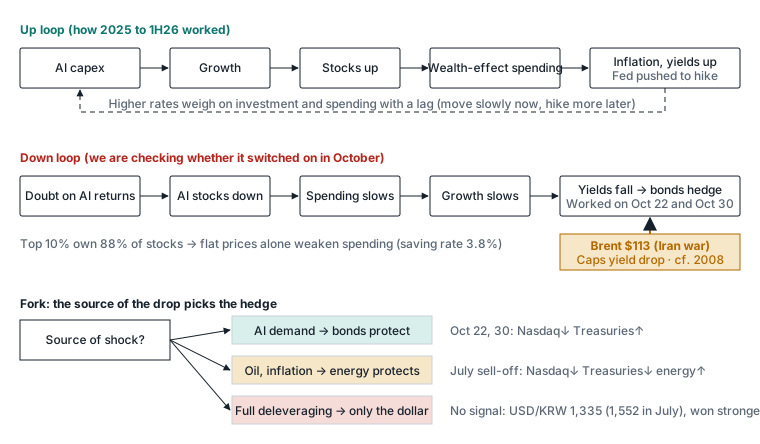
The up loop ends at the Fed. The Fed hiked in September and held at 3.75-4.00% on October 28. The vote was 10 to 2, and the two dissenters (Cook and Hammack) wanted a hike (CNBC, October 28). Futures price an 85.7% chance of a hike on December 9 (CME). The US 10-year yield touched 5.03% on the day of the meeting (CNBC) and closed October 30 at 4.93%. The 30-year is at 5.31%.
The pressure reaches the companies that fund AI. Three of the four big hyperscalers now have negative free cash flow. Amazon is at -$42.4 billion over the trailing twelve months (CNBC, October 29), Alphabet at -$9.1 billion for the quarter, and Meta is also negative for the quarter (reported figures with different period bases). Microsoft has signaled bond market funding. When capex moves from cash to debt, rates become a variable in the capex plan.
The down loop runs the other way. When AI stocks fall, spending and growth slow, and yields fall. This loop actually worked on October 22 and 30: on the days the Nasdaq fell, Treasury prices rose. In the down loop, bonds hedge stocks.
The problem is oil. Brent for January delivery was $113.43 on October 30, held up by the Iran war and the risk to the Strait of Hormuz. US PCE inflation is 3.6%, and core is 3.1%. While oil holds inflation up, the Fed cannot easily cut even if growth weakens. In June 2008, the Fed statement also cited oil-driven inflation pressure (FOMC statement, June 25, 2008).
The contrast with 2018 is clear. In Q4 2018, the S&P 500 fell 19.8% from September 20 to December 24. Oil (WTI) collapsed from $76 to $43, and on January 4, 2019, Powell could talk about “patience” and change course. That exit is narrow now. This is why we see a fatter tail in this episode than in an ordinary correction.
Consumption has a slower loop too. Of the 3.4% US GDP growth in Q3, 1.61 percentage points came from inventories, and final domestic sales grew 1.7%. The saving rate is 3.8%, the lowest since October 2022 (BEA). Most stocks are held by the top of the distribution, so flat stock prices alone can weaken spending. This loop works more slowly than capex, so we track it separately through the late-November saving rate and real spending.
The market sold the shelf life of supplier profits
If the price of money is the backdrop, flows show what was sold. We collected stock-level foreign trading in Taiwan and Korea from September 21 to October 30.
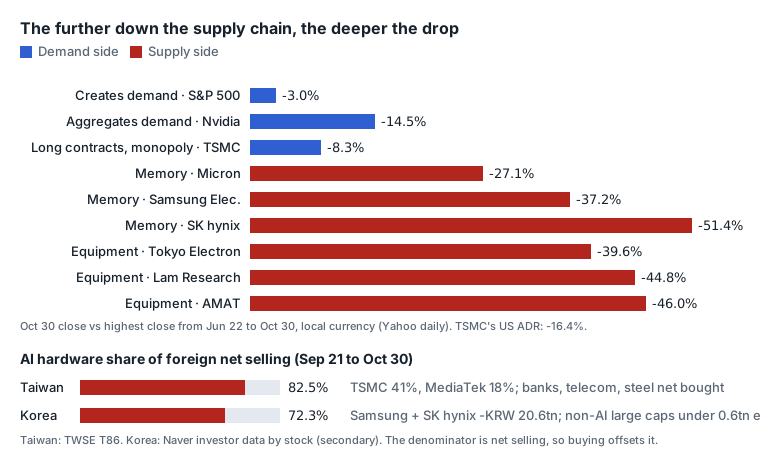
Foreigners sold AI hardware in Taiwan and Korea, and little else
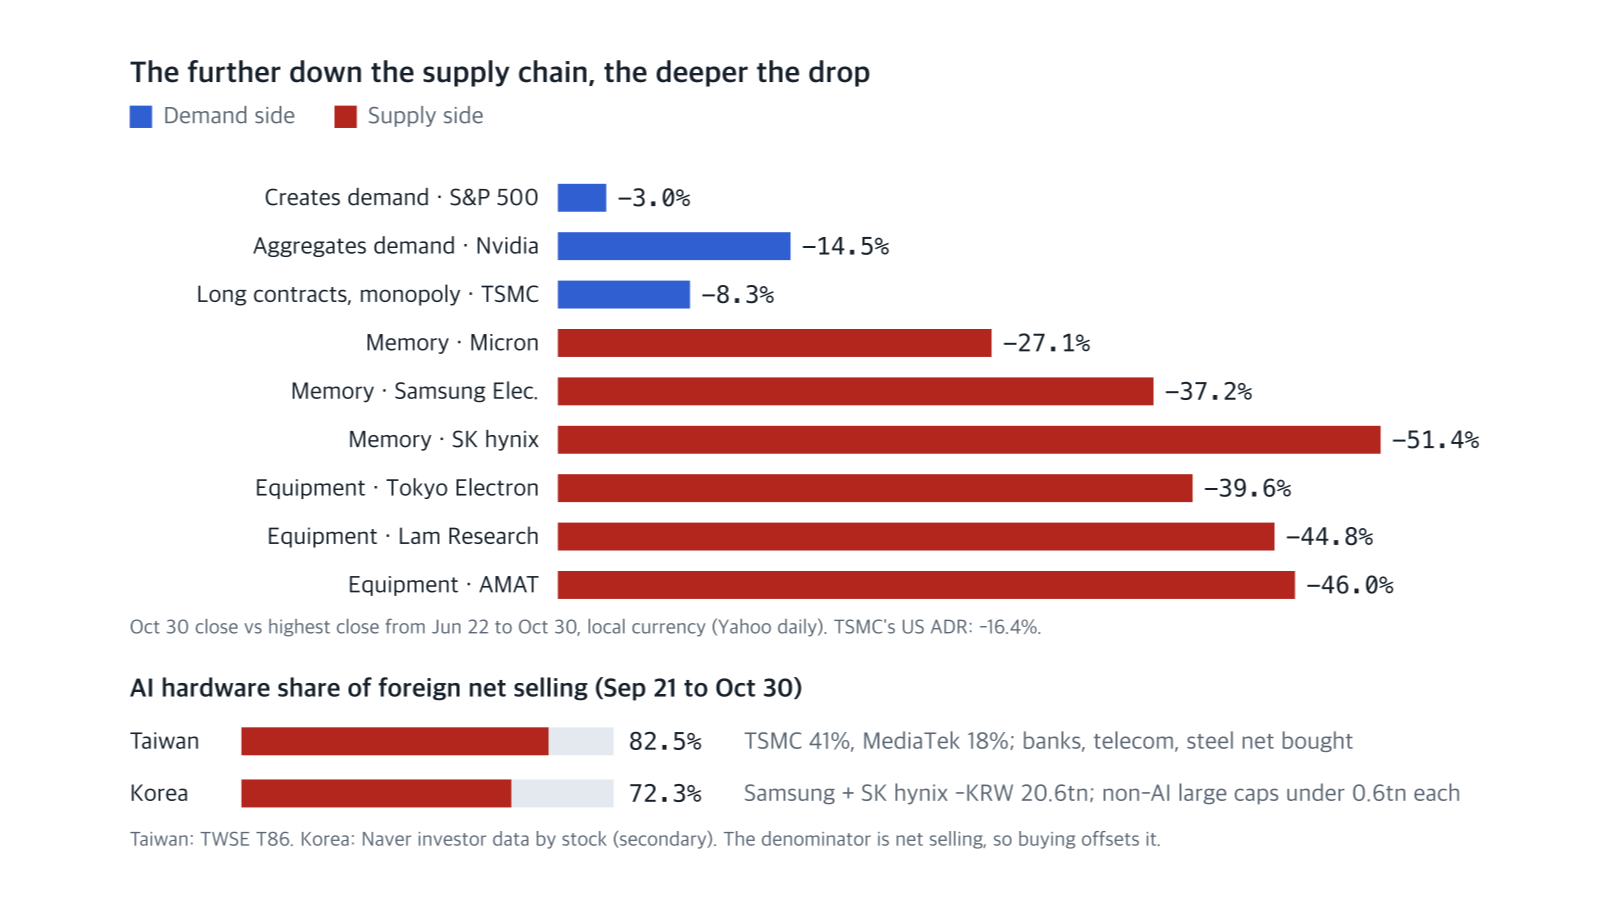
Taiwan Stock Exchange (TWSE) stock-level data show foreign net selling of TWD 955.9 billion over 25 trading days. TSMC was 41% of it, MediaTek 18%, and Delta Electronics 8%. The top 11 AI hardware names add up to 82.5%. Foreigners were net buyers of Chunghwa Telecom, the Fubon, Cathay and CTBC financial groups, and China Steel.
| Stock | Foreign net buying (TWD 100m) | Share of net selling | Domestic funds net buying (TWD 100m) |
|---|---|---|---|
| TSMC | -3,905 | 40.9% | +569 |
| MediaTek | -1,744 | 18.2% | +162 |
| Delta Electronics | -738 | 7.7% | +105 |
| UMC | -410 | 4.3% | -295 |
| AVC | -253 | 2.6% | +134 |
| Nanya | -240 | 2.5% | -94 |
| Chunghwa Telecom, three financials, China Steel | +120, +123, +51 | Net buying | Mostly net buying |
| Foreign total | -9,559 | 100% | Domestic funds total +2,092 |
TSMC’s 41% is close to its weight in the Taiwan index, so that is close to proportional selling. MediaTek’s 18% is far above its single-digit index weight. Taiwan’s domestic funds bought TSMC worth TWD 56.9 billion over the same period.
Korea looks the same. Naver’s stock-level investor data (a secondary compilation) show foreigners sold KRW 28.5 trillion of KOSPI stocks over the period. SK hynix accounted for KRW 16.5 trillion and Samsung Electronics for KRW 4.2 trillion, together 72.3%. That is far above the two stocks’ combined market cap weight (around 40%).
| Stock | Foreign net buying (KRW tn) | Foreign ownership 9/18 to 10/30 | From high |
|---|---|---|---|
| SK hynix | -16.47 | 50.23% to 48.67% | -51.4% |
| Samsung Electronics | -4.15 | 46.46% to 46.15% | -37.2% |
| Doosan Enerbility | -0.58 | 23.12% to 22.11% | -41.8% |
| KB Financial | -0.39 | 78.95% to 78.17% | -16.5% |
| Hyundai Motor | -0.34 | 24.36% to 24.10% | -51.5% |
| KOSPI total | -28.52 | -37.1% |
If foreigners were leaving the country, they would have sold banks, telecom and steel too, and the won would have weakened. Instead, banks and telecom saw net buying, and USD/KRW fell 13.1% from 1,539 on June 22 to 1,338 on October 30. The won gained 15%. The foreign selling in both markets reads as a cut in one factor, AI hardware. We see no trace of a country exit.
The further down the supply chain, the deeper the drop
Line up drawdowns from the highest close in the June 22 to October 30 window by supply chain position, and a slope appears. Because of the window, Samsung’s figure differs slightly from the table above (June 18 high, -37.9%).
| Chain position | What sets profit | Stocks and drawdown |
|---|---|---|
| Creates demand | Own service revenue | S&P 500 -3.0%, QQQ -9.1% |
| Aggregates demand | Total customer orders | Nvidia -14.5% |
| Long contracts, monopoly | Contracts and technology lock-in | TSMC -8.3% (US ADR -16.4%) |
| Memory | Selling price | Micron -27.1%, Samsung -37.2%, SK hynix -51.4% (average of five, -31.6%) |
| Equipment | Customer orders | AMAT -46.0%, Lam Research -44.8%, Disco -44.0%, Tokyo Electron -39.6% (average of six, -38.4%) |
The order matches how cyclical each group’s profit is. An equipment maker loses sales when orders stop. A memory maker loses profit when prices turn. TSMC defends its prices with long contracts and a technology lead. Nvidia sits where demand is aggregated, and hyperscalers create the demand.
Think of restaurants and farms. If customers were leaving a neighborhood, the restaurants that serve them would suffer first, and the farms and farm-equipment makers that supply them would suffer later. Today it is the opposite. The farm-equipment makers fell most, and the restaurants barely moved. What the market doubts is less the number of customers than whether the farm can keep charging today’s high prices in 2028.
There are exceptions. SK hynix at -51% fell more than any equipment stock, a mix of Korea-specific and company-specific factors. TSMC’s local shares fell less than Nvidia. Peak timing splits in two as well. Most suppliers peaked in late June and fell for four months. The demand side, US indexes and TSMC peaked on October 6 and fell for one month. The core of this factor cut is that supplier stocks fell from late June to October 6 while demand-side stocks rose. The slope held through the broad market drop after October 6 (AMAT -26.4%, SK hynix -20.0%, Micron -15.4%, Nvidia -14.5%, TSMC -8.3%).
In Korea, a domestic unwind sits on top
Korea needs one more explanation. Hyundai Motor (-51.5%), Hanwha Ocean (-57.1%), HD Hyundai Heavy Industries (-42.7%), Doosan Enerbility (-41.8%) and Kia (-40.5%) fell as much as memory. Yet foreign net selling in each was under KRW 0.6 trillion. Foreigners did not sell them.
This part is a domestic unwind. Margin loans fell from KRW 38.6 trillion in June to KRW 32.75 trillion on October 15 (Seoul Economic Daily, October 18). Forced selling of margin positions reached KRW 89.3 billion on October 14 alone (Herald Business). Korea’s drop is the global AI hardware factor plus a domestic unwind of the whole 2026 leadership basket. We estimate that about half of Korea’s drawdown came from this market structure: concentrated foreign selling, substitution into overseas products, and forced margin selling. These are flows that can reverse, which supports the cyclical case.
What the demand-breakdown hypothesis would need to show
The counterargument is clear. The market may have priced a future demand slowdown early and sold the suppliers with the most operating leverage first. Prices alone cannot rule this out. So we checked current demand indicators separately.
| Indicator | If demand were breaking | Now |
|---|---|---|
| Demand-side and aggregator stocks | Hyperscalers, Nvidia and TSMC fall with or before suppliers | S&P 500 -3%, Nvidia -15%, TSMC -8% vs equipment -45% |
| Capex | At least one hyperscaler slows | All four keep 2027 growth |
| AI server shipments | Taiwan server ODM sales slow | Six Taiwan AI server makers: September sales +57% YoY |
| Physical build-out | Data center construction falls | US August +73%, eight straight months of growth |
| Currency | Supplier-country currency weakens (exports fall) | Won 15% stronger |
None of these shows up now. The way to tell the two stories apart is sequence. If demand-side shipment, utilization and capex outlooks are cut first, the demand hypothesis is right. If demand outlooks hold while only supplier price and margin outlooks are cut, the supplier-profit hypothesis is right. Taiwan memory makers’ October sales on November 10 and Nvidia’s guidance on November 17-18 will show the order.
Four months paid for a full cycle’s drop
Korean memory and global equipment have already matched the full drawdowns of the last two downcycles.
| Stock | 2018 downcycle | 2021-22 downcycle | This time (June high to 10/30, four months) |
|---|---|---|---|
| SK hynix | 2018-04 to 2018-11, -35% | 2021-01 to 2022-11, -47% | -51% |
| Samsung Electronics | 2017-09 to 2018-11, -30% | 2021-01 to 2022-08, -36% | -37% |
| Micron | 2018-05 to 2018-10, -35% | 2021-12 to 2022-09, -46% | -27% |
| AMAT | 2018-02 to 2018-10, -43% | 2021-12 to 2022-09, -48% | -46% |
Past cycles use monthly closes and this one uses daily closes, so the bases differ slightly. The table compares size only. It does not say the drop is fully priced. The same drawdown means different things depending on the starting valuation and the normal earnings outlook.
That narrows the meaning. For prices to fall further, the earnings normalization in this downcycle must be deeper than in 2018 and 2022. A CXMT-driven oversupply in 2028 is that path. Or the normal earnings outlook must keep falling. As long as 2027 estimates hold, Samsung at 3.1 times 2027 earnings and SK hynix at 2.8 times are close to prices that have already paid for a downcycle. At a normal P/E of 8-12 times, Samsung’s current price equals a 57-72% fall in earnings (our conditional calculation). That is deeper than the 2019 downcycle’s operating profit decline (-53%).
Memory stocks moved two to four quarters ahead of prices
In the 2017-18 cycle, stock peaks (Samsung in November 2017, SK hynix and Micron in May 2018) came two to four quarters before the DRAM contract price peak (Q3 2018). DRAM revenue hit a record in Q3 2018 and began to fall in Q4 (TrendForce, November 2018). The stock low (December 2018) came while contract prices were still falling. PC DRAM contract prices fell about 30% in Q1 2019 (secondary source). 2000 followed the same order: Micron peaked in August 2000, and prices collapsed in the second half of that year.
Apply this order to today, and the June stock peak reads as pricing a 2027 first-half price peak two to four quarters early. Industry tallies show quarterly contract price increases slowing from about 80% in Q2 to about 40% in Q3 and about 20% in Q4 (forecast). Prices are still rising, but more slowly, and stocks sell the slowdown first.
This sequence has an uncomfortable implication for investors. In 2018, the stock low also came two to three quarters before the price low. A plan to wait for fundamental confirmation and buy back ends up buying 30-50% above the low.
Who sold, and who is left
Sellers move prices directly. Split them into stages and the asymmetry ahead becomes visible.
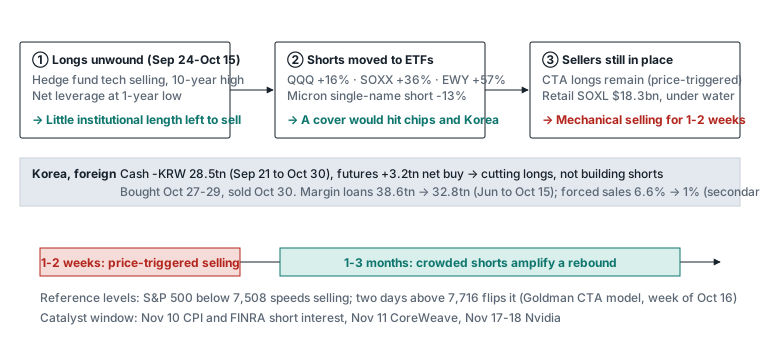
First, large investors emptied their longs between late September and mid-October. Prime broker data showed hedge fund net selling of tech at its largest since 2016, and net leverage at a one-year low (secondary reports). Not much institutional length is left to sell.
Second, shorts moved into index ETFs. In the FINRA October 15 settlement, QQQ short interest rose 16%, the SOXX semiconductor ETF 36%, and the EWY Korea ETF 57% (FINRA short interest). Micron single-name short interest fell 13%. Shorts betting on company fundamentals left, and index-level hedges remained. If shorts cover, the buying concentrates in chips and Korea.
Third, the sellers still in place are trend-following funds (CTAs) that sell with price, and retail leverage under water. SOXL, the 3x leveraged chip ETF, has about $18.3 billion of net assets. These sellers sell more as prices fall, but their size shrinks with price. Their selling is finite.
In Korea, foreigners sold KRW 28.5 trillion of cash stocks but net bought KRW 3.2 trillion of domestic futures. They are cutting longs, not building shorts. They were net buyers for three days from October 27 to 29 and sold again on the 30th. The forced-sale share of margin positions fell from 6.6% to about 1% (October 26, secondary compilation).
So the time axis splits. Over the next one to two weeks, price-triggered mechanical selling has the upper hand. Over one to three months, crowded shorts favor an outsized rebound. Short covering, though, does not come from falling prices alone. It needs news. The candidates are November 10 inflation and short interest data, CoreWeave earnings on November 11, and Nvidia earnings on November 17-18.
Sentiment gauges show no panic. The VIX at 19.42 is below the three-month VIX at 20.78, the normal shape in which near-term fear is smaller than longer-term worry. But in BofA’s October fund manager survey, cash was 3.9% and the net overweight in tech was 37%, the largest since August 2020 (Yahoo Finance summary). The survey ran October 2-8, so it misses the mid-October drop. US institutions are still heavy in tech, and that remains a tail risk.
What history says: US indexes mostly held, chips fell further
Since 1995, there have been 13 days on which the Philadelphia Semiconductor Index was more than 20% below its 52-week high while the S&P 500 was within 5% of its high (thetrading.tools, secondary source).
| Measure | Value |
|---|---|
| Cases where the S&P 500 fell into a 20%+ bear market | 2 of 13 (April 2000, December 2007) |
| Cases where it did not | 11 of 13 |
| Median SOX return after the signal | -3.4% at six months, +19.2% at twelve months |
| Median further SOX drop within twelve months | -21.3%. In 8 of 13 cases, SOX fell another 20% or more |
| 2026 | July 17 (SOX -20.2%, S&P 500 -2.0%) and October 22 (SOX -26.7%, S&P 500 -2.0%). The source treats them as one episode |
The first reading is the resilience of US indexes. In 11 of 13 cases, US large caps did not fall into a bear market. In the two that did (2000 and 2007), the earnings cycle was already turning: DRAM prices collapsed in the second half of 2000, and financial sector profits broke in 2007. Today, earnings estimates are rising.
The second reading is the further drop in chips. After the signal, the semiconductor index itself fell another 20% or more in 8 of 13 cases. US index resilience does not make a chip-heavy account safe. The rule in this study (-20% from a 52-week high) differs slightly from today (-27% from the 2026 high), and it comes from a single secondary source.
The precedents for a decline during tightening are Q4 2018 and 2022. In Q4 2018, the S&P 500 fell 19.8% and stopped at the bear-market threshold. In 2022, it fell 25.4%, from 4,796.56 to 3,577.03, and the Nasdaq fell 35%. Both ended when the Fed changed direction and credit markets absorbed the shock. Today the Fed is at the start of a hiking cycle, and oil blocks a turn. This is why we keep the 2022-type path open.
The switches that would change the call
To avoid changing the call on feelings, we set the conditions in advance. The switches fall into a demand group (T1, T2), a financial group (T3, T4) and currency (T5).
| Switch | Turns on when | Status on November 1 | When to check |
|---|---|---|---|
| T1 Earnings | Samsung or SK hynix 2027 or 2028 consensus turns to annual cuts, Q1 2027 contract prices are forecast to fall, or order cancellations and delivery delays are confirmed at first hand | Off. Estimates still rising (October 23), Q4 prices seen higher | November 5, November 10, late December |
| T2 Capex | One hyperscaler cuts or defers 2027 capex, or Nvidia misses guidance or its $279 billion supply commitments shrink | Amber. Alphabet “significantly higher in 2027,” Amazon “meaningfully more,” Microsoft trimmed 2026 by $5 billion | November 17-18, late January |
| T3 Credit | High-yield spread at 350bp or more, pulled deals or a jump in funding costs, Oracle 5-year CDS at 300bp, CoreWeave 2032 bonds below 75 cents | Off. High yield 326bp, investment-grade client buy/sell ratio 1.22 | November 7, November 11, daily |
| T4 Fed and oil | A December 9 hike, Brent holding $110 and the 10-year back above 5.3%, all together | Off. Hike 85.7% priced, Brent $113, 10-year 4.93% | November 6, November 10, December 9 |
| T5 Currency | KOSPI down 5% or more over five sessions together with USD/KRW up 3% or more over five sessions (or above 1,400) | Off. In the 1,330s, won stronger | Daily |
The rule is this. Two switches in the same group (T1 and T2, or T3 and T4) count the same shock twice. The call changes to “structural bear market” when two or more switches from different groups turn on together. If only one turns on, we watch more closely. If a single signal is large, such as an Nvidia guidance miss or high yield at 400bp, we reassess at once.
As of November 1, no switch is on. There are amber signals. Microsoft trimmed its 2026 capex slightly. Intel’s explanation also deserves attention. Intel cut its Q4 guidance and named memory prices as a reason for weaker PC demand, and its stock fell 29% (CNBC, October 31). It is the first case of higher memory prices raising customers’ costs and eroding commodity demand. Because this is how memory strength can eat into its own demand, we record it as a leading signal for T1.
Items we could not check stay as “not yet seen.” We do not count them as “off.” These include consensus revisions after the October 29 earnings calls, short interest for the October 30 settlement, and first-hand Oracle CDS quotes.
We also mark the path on the credit side. The high-yield spread is low at 326bp, but both ends of the rating scale are widening. AA spreads are at 65bp, the 98th percentile of the last three years, and CCC spreads are at 1,325bp (FRED). At the top, heavy hyperscaler issuance creates supply pressure; at the bottom, spreads price default. If pressure from the price of money spreads into demand, the entrance is likely the tail of neoclouds and the lowest ratings. Hyperscaler high-grade bonds would be the last to shake.
The strongest objections, and our answers
Objection one: “Earnings are this strong, so the drop is just an opportunity." We also see the cyclical path as the base case. But stocks move before earnings. In 2000 and 2007, earnings were still good when the decline began. Strong earnings cannot close the structural path. We keep the credit-crunch and demand-slowdown paths open and check whether they actually open with the switches.
Objection two: “The market simply priced a future demand slowdown first." That is possible. Suppliers with the most operating leverage also fall first when a demand slowdown is priced early. Sequence settles it: are demand-side outlooks cut first, or only supplier price outlooks? Equipment versus memory relative strength is another clue. If equipment rebounds first with rising estimates, expansion continues, and the 2028 supply fear stays valid. If memory rebounds first, supply discipline is winning.
Objection three: “The US is not even in a correction, yet only Korea fell. Isn’t Korea simply oversold?" Partly, yes. A large part of Korea’s drop came from its market structure: concentrated foreign selling and forced margin selling. That part is a flow that can reverse. If non-AI leaders recover before memory, the domestic factor is easing. The part left in memory will ease only when evidence of 2028 supply discipline appears.
What this means for investors
First, tie the call to the switches. Prices have already paid for a cycle-sized drop, and the selling left is finite, mechanical selling. But if two switches from different groups turn on, defense comes first, even if prices look cheap.
Second, waiting for fundamental confirmation has a cost. If 2018’s order repeats, the stock low comes before the price low. Waiting for confirmation means buying late. Buying now, on the other hand, means sitting through one to two weeks of mechanical selling.
Third, the resilience of US indexes does not protect a portfolio concentrated in chips and Korea. In the history table, the chip index fell another 20% or more in 8 of 13 cases. Now is the time to check whether you can carry the size of your concentration.
What to watch over the next six weeks
| Date (Korea time) | What to check | How to read it | Switch |
|---|---|---|---|
| November 2 | Foreign cash and futures flows in Korea, Samsung and SK hynix relative strength | Selling both cash and futures speeds the drop; selling cash while buying futures means the position cut continues | T5 |
| November 3-4 | US midterms, Iran strikes or a deal | Strikes mean an oil shock (Brent above $110); a deal means an oil drop and a tech rebound | T4 |
| November 5 | Samsung and SK hynix 2027 consensus | A turn to annual cuts means T1 | T1 |
| November 6 | US October payrolls | Under 50,000 jobs with a falling 10-year points to a demand slowdown | T4 |
| November 7 | Absorption of bond supply | Investment-grade client buy/sell below 1.0 and high yield at 350bp mean T3 | T3 |
| November 10 | US CPI, FINRA short interest, Taiwan October sales | Falling ETF shorts mean covering has started; month-on-month declines at Nanya and Winbond mark the peak in price momentum | T1, T4 |
| November 11 | CoreWeave earnings | Funding, utilization, cash flow, 2032 bonds at 75 cents | T3 |
| November 17-18 | Nvidia earnings and guidance | A guidance miss means T2 | T2 |
| December 9 | FOMC | Whether it hikes, and the statement wording | T4 |
The daily tells are equipment versus memory relative strength, Korean non-AI leaders versus memory, and whether foreign selling spreads into banks and telecom. If foreign selling spreads into banks and telecom while the won weakens, that is a country exit.
Which switch do you think flips the call first? Pick one of Taiwan memory sales on November 10, Nvidia guidance on November 17-18, or a 350bp high-yield spread, and tell us why.
This is for research and information only, not investment advice. Estimates and scenarios are analytical assumptions, not trading instructions or individual portfolio decisions. Figures are dated data, and Naver investor data and some reported figures are secondary compilations. We used Anthropic’s Claude for research and editing. Anthropic appears in the AI demand chain discussed here as a customer and compute buyer.