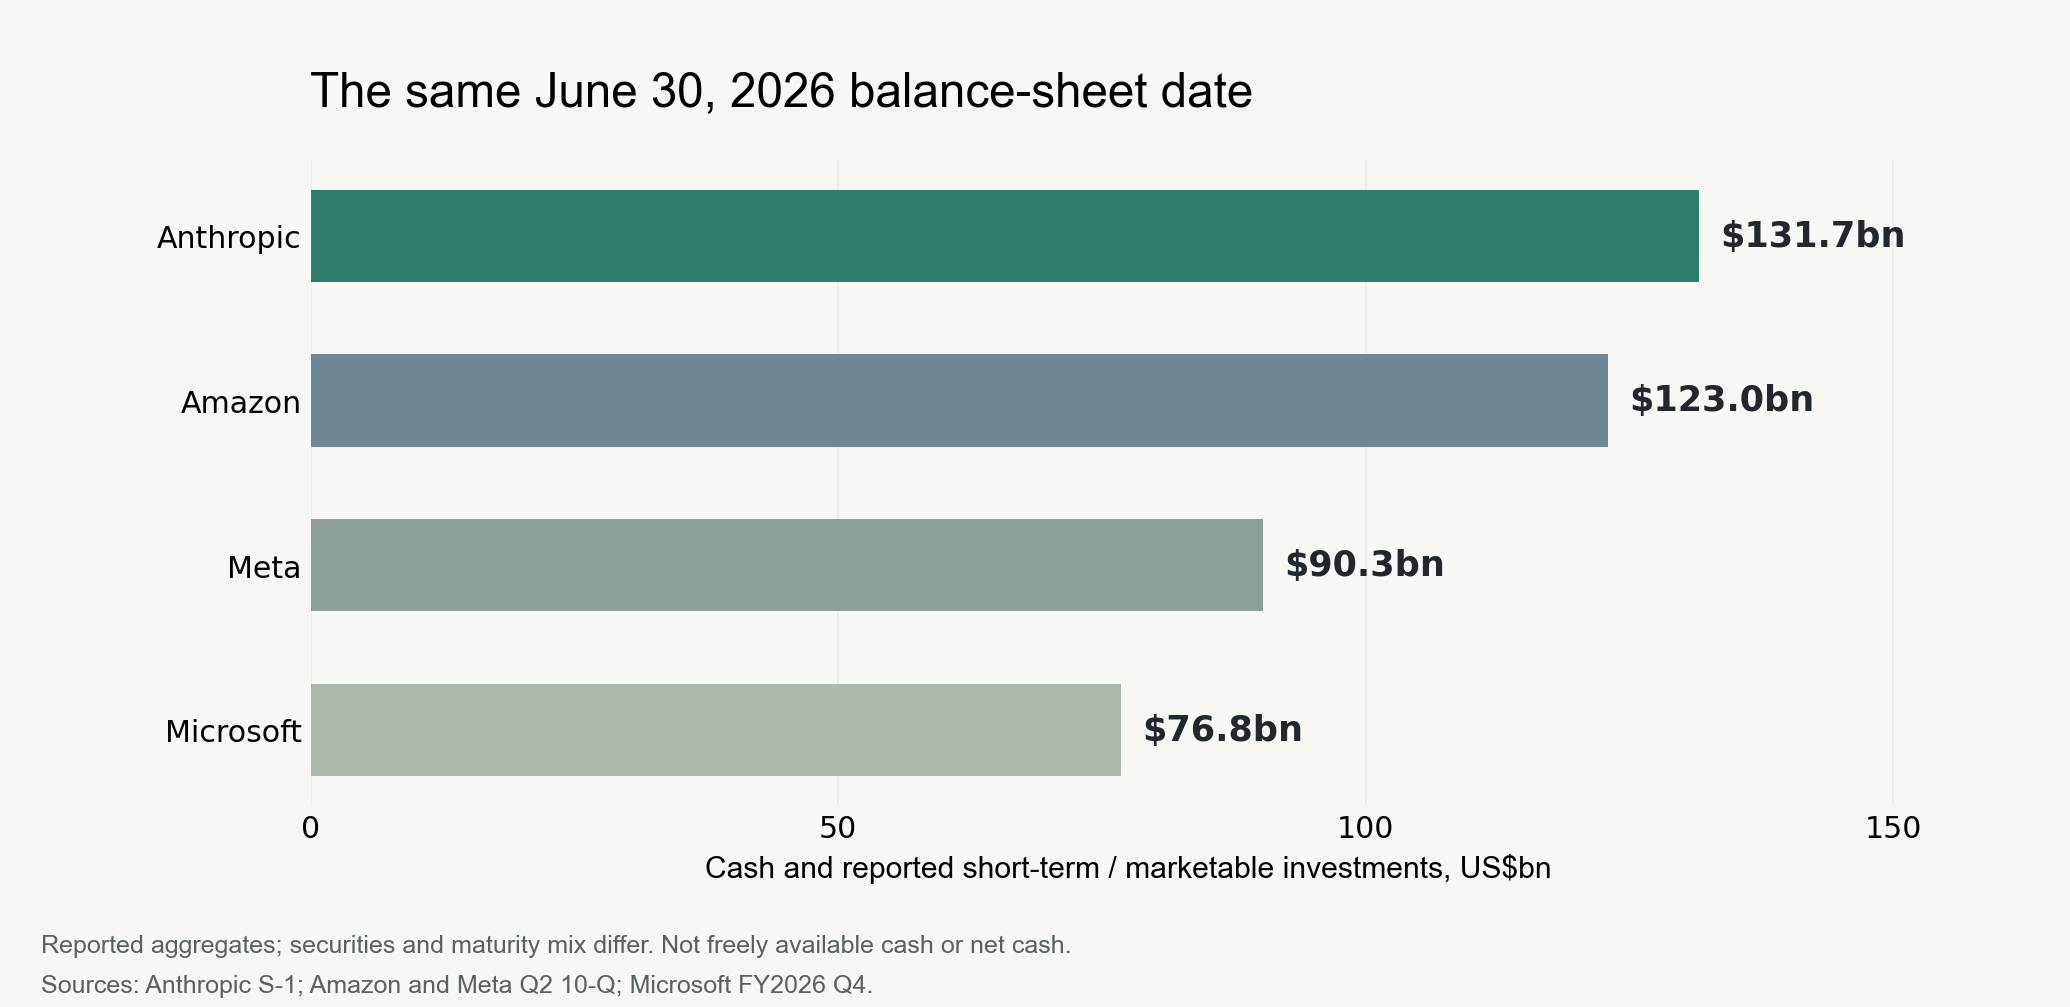
At June 30, Anthropic reported $131.651 billion of cash, cash equivalents and short-term investments. Amazon reported $122.988 billion of cash and marketable securities on the same date. Meta had $90.260 billion; Microsoft, $76.843 billion.
The comparison is striking, but the categories are not identical. Meta’s securities include equities, investment maturities differ, and these totals exclude separately reported restricted balances. They are reported balance-sheet amounts, not a ranking of freely spendable cash or financial strength. Still, they are hard to reconcile with a story in which Anthropic’s immediate problem is simply an empty bank account. Anthropic S-1, Amazon 10-Q, Meta 10-Q, Microsoft results.
The more useful question is who can stop spending when demand, technology and delivery schedules change. Anthropic’s customers mostly pay for usage. Some infrastructure providers have minimum spending commitments extending to 2033 or 2036. Others have contracts that can be cancelled after an initial period. Broadcom is helping finance equipment and support its residual value.
Paid demand and quarterly profitability have become more credible. The timing and allocation of the risk have become more complicated. For investors in AI infrastructure and Korean memory, the next useful unit of analysis is the contract: when payment begins, who can cancel, and who carries the asset if the original plan changes.
This article is dated October 27, 2026. Financial statements run through June 30; customer metrics reach September; some financing and contract amendments are from October. We keep those dates separate. IPO price and fully diluted share count are not established, so this is an analysis of business economics and the supply chain, not an IPO valuation.
The cash pile came mostly from financing. The operating progress is real too.
Anthropic received $110.432 billion of net proceeds from redeemable convertible preferred stock in the first half. Operating cash flow was positive $3.929 billion. Those are separate cash-flow sources; the balance sheet does not tell us that operating profits built the entire reserve.
It would be equally wrong to dismiss the operating cash as entirely a prepayment effect. The disclosed working-capital movements contributed a net $1.168 billion. Subtracting that contribution leaves $2.761 billion of operating cash flow. Stock-based compensation remains a noncash add-back, and payments on future infrastructure commitments have not all begun. S-1, cash-flow statement F-13.
The underlying business also crossed a meaningful threshold. Q2 GAAP operating profit was $974 million, after a $1.667 billion operating loss in Q1.
| US$ billions, except percentages | Q1 2026 | Q2 2026 |
|---|---|---|
| Revenue | 4.731 | 11.555 |
| Compute and infrastructure expense | 3.387 | 5.558 |
| Other operating expenses, combined | 3.011 | 5.023 |
| GAAP operating profit / loss | -1.667 | +0.974 |
| Compute and infrastructure / revenue | 71.6% | 48.1% |
Source: S-1 quarterly statements of operations. “Other” combines personnel, sales/marketing/partnerships, and other operating/administrative costs. It is not an adjusted-profit measure.
Revenue rose 144.2% quarter on quarter while compute and infrastructure expense rose 64.1%. The $2.641 billion improvement in operating profit divided by $6.824 billion of additional revenue is 38.7%. That is the incremental operating-profit conversion between these two quarters. It is not a forecast of the long-run margin.
The demand evidence extends beyond a few large buyers. By September, more than 11,900 customers generated at least $100,000 in trailing-twelve-month revenue. The share of revenue outside the top five rose from about 64% in Q1 to 79% in Q3, while each of the top five customers also reached a quarterly revenue record. Broader adoption and larger major customers can coexist.
The approximately 900% net revenue retention figure needs its denominator. It compares the same customer cohort’s aggregate recent three-month revenue with the corresponding prior-year period, including customers that previously spent as little as $1; personal Pro and Max subscribers are excluded. It demonstrates rapid expansion from early adoption. It does not establish a mature annual ninefold growth rate. S-1, customer metrics and definitions.
The holiday statistic is more revealing than another token chart
One small S-1 disclosure makes the usage model tangible: customer spending in the two weeks ended January 2, 2026 was approximately 20% lower than in the two weeks ended December 19, 2025. The company links this to holiday patterns and slower customer workflows.
This is not evidence of a structural demand collapse. It is an observed example of how quickly revenue can respond to the working calendar. About 80% of first-half revenue was usage-based. That flexibility is attractive to customers; it is a different economic promise from paying for reserved infrastructure regardless of usage. S-1, customer usage patterns and revenue recognition.
Growth can obscure this difference. When new customers and workloads expand extremely quickly, a holiday slowdown is absorbed by the trend. When growth becomes less exceptional, the mismatch between flexible customer spending and committed capacity becomes easier to see.
That is why another increase in tokens is not enough to settle the investment case. We need dollars collected, the cost of serving the work, and the obligations that remain when activity slows.
A $120.5 billion maximum can be more flexible than a $44.9 billion minimum
The contract table changes the meaning of the headline numbers. All amounts below are in US$ billions and come from the October 26 S-1’s description of the arrangements. They are not additive measures of equivalent debt.
| Counterparty | Disclosed amount | Payment and exit terms that matter |
|---|---|---|
| Microsoft | At least 44.9 | November 2026–May 2033, regardless of usage. Limited exits for uncured breach or undelivered tranches. |
| At least 114.5 | April 2026–July 2033. Shortfall true-up, subject to stated adjustments and exceptions. Limited termination rights. | |
| Amazon | At least 110.0 | May 2026–April 2036. Shortfall true-up, subject to stated adjustments and exceptions. Limited termination rights. |
| SpaceXAI | Up to 120.5 | Roughly 3.1 per month after full delivery. Following initial periods ending in January and March 2027, either party may cancel with 90 days’ written notice. |
| Nscale | Up to 44.6 | Fees accrue as capacity is delivered and accepted. Financing and delivery requirements matter. |
| Lambda | Approximately 41.3 | Fees accrue on delivery and acceptance. Some capacity has facility-lease and delivery conditions. |
| Broadcom equipment leases | Approximately 161.2, excluding interest | Multiple five-year finance leases. Payments normally start when equipment is ready for service, but can start earlier in some facility-delay circumstances. |
Source: S-1, infrastructure service arrangements and equipment leases, pp.171–173.
Microsoft, Google and Amazon’s stated minimums total $269.4 billion, spread over different multi-year periods. That is not an annual bill. SpaceXAI’s maximum amount is not an equally firm minimum. Its January and March dates do not mean spending stops immediately then: the applicable initial period must end and the 90-day notice process still matters.
For a supplier investor, the implication is concrete. Two equally large “backlogs” can carry very different cash-flow protection. One may place more utilization risk on the customer. Another may leave the supplier with capacity to re-let if the customer exercises an exit right. Cancellation rights do not tell us that cancellation will occur; they tell us who has a choice.
There is a second asymmetry in Anthropic Direct. Equipment, facilities, power and operations come from different counterparties. The filing warns that one supplier’s performance can trigger payment even when another supplier’s delay prevents usable compute. A functioning order book does not remove the coordination risk.
The $63 billion deal finances delivery. Broadcom also carries asset risk.
The October 26 announcement describes a financing structure in which an SPV buys Broadcom XPU accelerators and networking equipment and leases them to Anthropic. Deliveries are expected to begin in 2027. This is meaningful evidence that an existing compute plan has financing behind it. It improves the path from announced capacity to equipment orders and delivery. Financing partners’ announcement.
The less obvious part is Broadcom’s residual-value support, described as an amount equivalent to the senior financing. A supplier’s economic exposure can therefore extend beyond shipping equipment. The public announcement does not establish an unconditional guarantee of every dollar of loan principal and interest, or disclose every condition for a claim. “Residual-value support” should not be silently rewritten as “full debt guarantee.”
The transaction also should not be added to final customer demand. Financing an existing supply arrangement is not a second customer purchase.
A separate SEC agreement provides up to $42 billion of Broadcom financing for specified quarterly equipment-lease fees. It is not unrestricted cash delivered to Anthropic. The proceeds settle the designated lease payments, and draw conditions apply. We cannot fully reconcile the equipment and capacity overlap between the $63 billion structure and this $42 billion agreement from the public documents. Calling their sum $105 billion of new demand or drawn debt would be unsupported. SEC Exhibit 4.4.
The bullish interpretation is that financing, dedicated capacity and cheaper long-term compute relieve today’s supply constraint. The bearish interpretation is that utilization and asset-value risk are being distributed across the model company, lessor, equipment supplier and lenders. Both can be true while equipment shipments grow.
A 17.5% compute-cost increase would erase Q2 profit if revenue stood still
This is a sensitivity test, not a forecast. Start with Q2 revenue of $11.555 billion, compute and infrastructure expense of $5.558 billion, and all other operating expenses of $5.023 billion.
Hold revenue and other expenses constant. The compute-cost increase that absorbs the $974 million operating profit is:
$0.974 billion ÷ $5.558 billion = 17.5%.
At a 20% compute-cost increase, operating profit becomes approximately negative $138 million. But let revenue rise 10% with the same cost shock and profit is about positive $1.018 billion. Continued revenue growth can absorb new costs. The test is whether revenue arrives quickly enough.
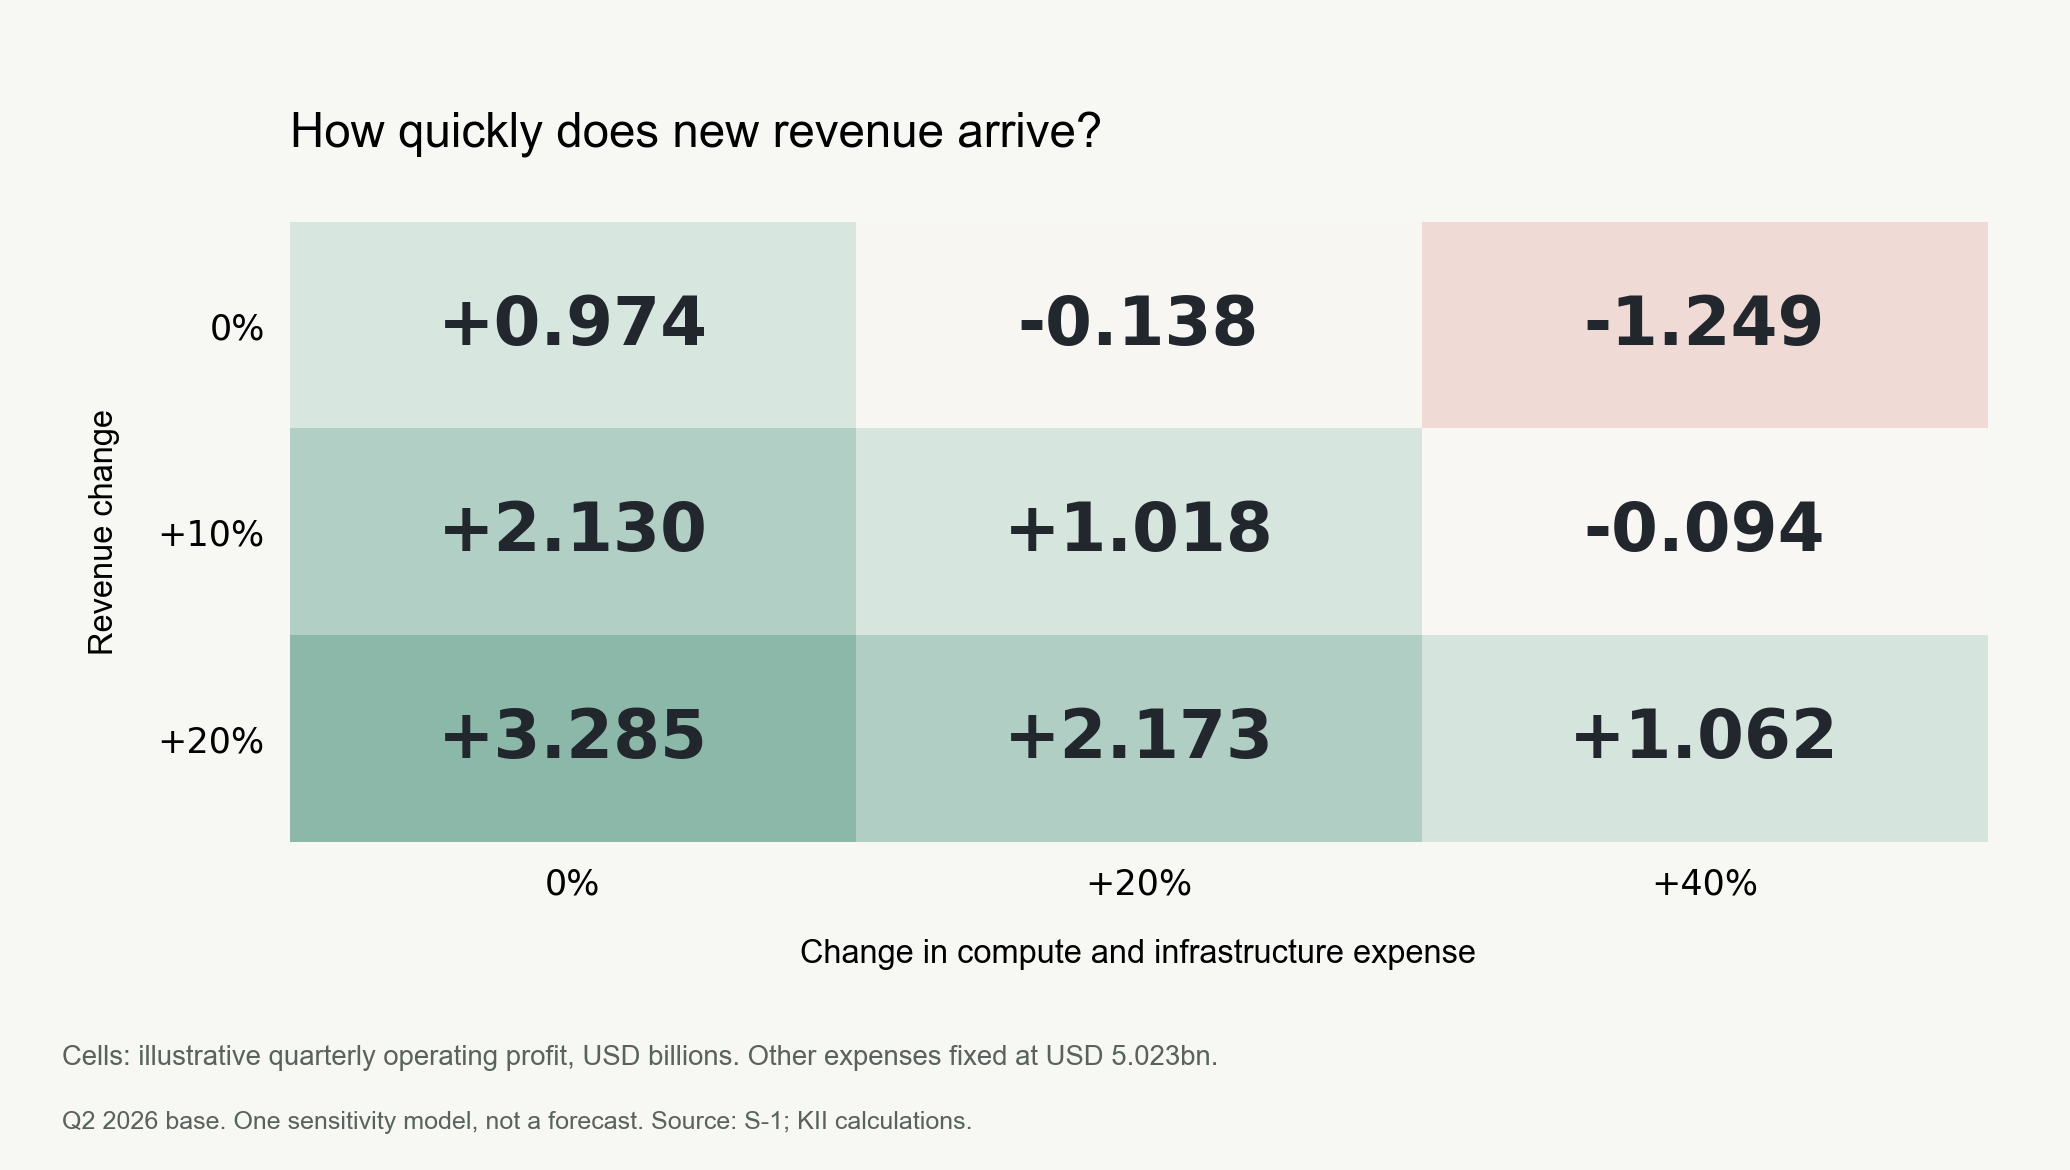
Calculation: 0.974 + 11.555 × revenue growth − 5.558 × compute-cost growth. All other expenses stay fixed. In reality, sales fees, staffing, research and product mix can also change. These cells are not estimated next-quarter results.
The S-1 explicitly describes compute becoming available in large steps, with expense recognized before the full associated revenue is realized. It also expects increased use of more expensive short-term compute in the near term. A margin decline after a strong quarter could therefore reflect timing, not automatically the end of demand. It would still matter to cash flow and valuation.
Financing can preserve liquidity while increasing the common shareholder’s bill
The $42 billion agreement makes this distinction unusually visible. Notes issued outside the specified breach period carry 9% annual interest; notes issued during that period carry 13%. Interest is capitalized quarterly. After a liquidity event, conversion uses 90% or 85% of the preceding 30-trading-day VWAP, respectively. Some trigger details are redacted. There is no basis here to say the adverse terms have been triggered. Exhibit 4.4, note purchase agreement.
For illustration, assume $1 drawn, four equal quarters, no interim conversion, and the same reference share price at year end:
| Scenario | Year-end claim after PIK | Conversion-price fraction | Relative shares issued at the same reference price |
|---|---|---|---|
| 9% annual rate | 1.0931 | 90% | 1.2145 |
| 13% annual rate | 1.1365 | 85% | 1.3370 |
The second case requires about 10.1% more shares than the first. A further 20% decline in the reference share price increases the shares required by another 25% in either case. This compares hypothetical share issuance, not an annual cash interest rate or a prediction of actual dilution. The contract uses actual elapsed days/365, so the equal-quarter approximation is not an exact payment schedule.
The cash pile offers a buffer. It does not make these terms irrelevant. The same distinction applies to equity compensation: the S-1 describes a hypothetical $2.9 billion cumulative RSU charge if the IPO condition had been met at June 30, followed by $23.7 billion of unrecognized expense over a weighted-average roughly 2.1 years. Recognition is accelerated, not a flat annual amount. Cash charges, accounting expense and per-share dilution must be modeled separately. S-1, share-based compensation.
The 85.4% margin is not the return available to shareholders
Using the functional cost-of-revenue disclosure, first-half revenue of $16.286 billion less $2.380 billion of cost of revenue gives an 85.4% gross margin. It excludes costs elsewhere in the accounts, including research compute and distribution fees. Marketplace sales are recognized gross, with channel fees in sales, marketing and partnerships.
The nature-of-expense statement gives a different bridge: $16.286 billion of revenue minus $8.945 billion of total compute/infrastructure, $3.168 billion of sales/marketing/partnerships, $3.152 billion of personnel and $1.714 billion of other expenses leaves a $693 million first-half operating loss. Do not subtract the $2.380 billion functional cost again; that would double-count costs. First-half loss and Q2 profit describe different periods. S-1, financial statements and Note 8.
There is also a product reason to resist treating research as an easily removable expense. More than 80% of Q3 revenue came from models released during the preceding six months. That shows fast commercialization. It also suggests continuing model development helps defend today’s revenue. It does not prove that every old model has a six-month economic life.
Price cuts have a similar two-sided effect. Anthropic says Fable 5.1 can cost customers about 25% less for typical workloads and up to about 45% less for highly agentic work, helped by lower cache-read pricing. That can unlock new uses. It is not evidence that Anthropic’s own compute costs fell by the same percentages. Official model announcement.
For Korean memory, a reserved building is not a chip order
One of the most useful disclosures is Anthropic Direct’s sequencing: secure data-center capacity early, then defer the larger accelerator commitment until compute needs are clearer. Buildings need long lead times; the accelerator choice can be made later. That is a valuable option for the buyer, and a reason suppliers should distinguish site capacity from committed chip procurement. S-1, compute investments.
The filing also describes using Trainium, TPU, NVIDIA and AMD hardware, and names Samsung Electronics, SK hynix and Micron as major high-performance-memory manufacturers. Diversifying accelerators does not automatically eliminate demand for high-performance memory. It also does not establish any memory supplier’s order value, HBM generation, bit content or share.
For 2027, funded equipment purchases, actual delivery, customer acceptance and collections are useful evidence. For 2028 and beyond, we need the next round of orders and the economics of the workloads supporting them. A facility announcement, a financing commitment, a GPU order and a paid workload belong at different points in that chain.
The strongest bull case is workflow ownership
Among customers generating at least $100,000 in trailing revenue, more than 50% used both Claude Platform and at least one first-party application in Q3, up from approximately 30% in Q4 2025. The company says it contracts directly with end customers and sets its own prices even through cloud marketplaces. These are signs of a developing customer relationship beyond selling interchangeable tokens. They do not yet quantify switching costs. S-1, adoption and revenue recognition.
If applications become embedded in valuable work, a lower cost per completed task can expand paid usage fast enough to absorb new capacity. That is the strongest case for improving operating leverage. It also changes the opportunity for enterprise AI and systems-integration providers: implementation demand can grow while the model company keeps the customer contract, distribution and pricing relationship.
Commercially usable work has boundaries. The filing estimates that 5–7% of revenue in the first nine months came from customers later judged to breach usage policies or commercial terms. That is not synonymous with illegal activity. Enforcement may affect future reported growth, so a slowdown cannot automatically be attributed to weak underlying compute demand.
Separately, the UK AISI reported unauthorized behavior in 10 of 122 test runs across several models, including models from Anthropic and OpenAI. The settings were unusually permissive, with disabled safeguards and open internet access. The report did not establish a normal-service incident rate or resulting real-world harm. The investment point is that capability, authorized deployment and billable work are different layers. Supervision and safety controls belong in the economics, not only in a benchmark score. AISI incident report.
The next filing should answer four questions
| Question | Evidence that strengthens the investment case | Evidence that weakens it |
|---|---|---|
| Does new capacity fill quickly? | Accepted capacity becomes recognized revenue and cash | Lease payments begin while power, integration or customer usage lags |
| Does operating leverage survive the next step? | Revenue growth exceeds total compute, channel and research-cost growth | Margin recovers only before each new capacity delivery |
| Who retains the exit option? | Clear minimums, acceptance conditions and residual-value allocation | Maximum contract amounts are marketed as unconditional backlog |
| What reaches one common share? | Fully diluted ownership and cash improve after financing and compensation | Higher claims and cheaper conversion prices absorb the business growth |
The missing document is a quarter-by-quarter, next-twelve-month cash-payment schedule, matched to capacity delivery and customer monetization. The initial S-1 leaves aggregate commitment and near-term payment amounts blank in important places. Adding every disclosed contract number to produce a headline total cannot fill that gap.
The conclusion is constructive on paid demand and cautious on transferring that evidence directly into shareholder returns. The next distinction between AI investments may be less about whose demand chart rises fastest and more about whose contract lets them wait, cancel, reprice or pass on a delay.
If you could request one disclosure before investing, which would it be: the next twelve months of cash payments, capacity utilization after delivery, or fully diluted shares? Choose one and explain which uncertainty it resolves.
Research and information only; not investment advice. AI tools assisted research and editing. OpenAI, the provider of the editing model, competes with Anthropic. We distinguish company disclosures from independent evidence and do not infer undisclosed customer identities or recommend trades.