We judge Microsoft the strongest overall. It has the most balanced mix of three things: the ability to sell technology to paying customers, recurring profit, and cash that is still left after heavy investment.
The category winners differ, though. Google leads in technology vertical integration, Meta in the own-model scores we could verify, and SpaceX in scarce physical infrastructure.
The reference date is October 25, 2026. Share prices are October 23 closes. We ranked on cash generation first, then paid distribution, then proven growth.
The overall ranking puts cash first, then paid distribution, then proven growth
The table below is a provisional ranking. It puts six companies on the same footing and lists each one’s strongest edge next to what holds its rank down.
| Provisional rank | Company | Strongest edge | What limits the rank |
|---|---|---|---|
| 1 | Microsoft | Enterprise work, developer and security channels plus Azure, strong cash generation | Reliance on outside frontier models; payback on AI spending |
| 2 | Models, TPUs, network, Search, Android and YouTube in one stack | Supply limits; moving Search to a new revenue model | |
| 3 | Meta | A competitive own model joined to ad monetization and consumer channels | Heavy spending, ad concentration, dilution and governance |
| 4 | Amazon | AWS customer base, own chips, advertising and commerce | Very large investment and a complicated consolidated capital picture |
| 5 | SpaceX | A rare mix of launch, satellite connectivity, compute and models | Large cash burn, acquisition integration, execution and funding risk |
| 6 | Oracle | Enterprise databases and large AI cluster supply | Debt, customer and supplier concentration, reliance on prepayments |
Meta and Amazon are close. Put more weight on growth speed and new business potential, and SpaceX moves up. This is not an expected-return ranking or a buy list. Prices and personal circumstances are a separate decision.
Microsoft wins because it turns good models into money
Microsoft’s trailing twelve-month operating cash flow is $182.9 billion and cash capex is $115.9 billion. Simple free cash flow is $182.9 billion − $115.9 billion = $67.0 billion. Free cash flow is the cash earned from operations minus what was spent on equipment. It means the company still has cash left after a very large investment.
Growth continues too. Azure grew 43%, and paid Microsoft 365 Copilot seats passed 30 million.1
These numbers matter because the revenue model survives a change of model leader. Microsoft holds the enterprise accounts, admin rights, purchasing contracts and work tools. Whichever model is ahead, revenue can come through that channel.
The weak points are clear. Microsoft leans on outside frontier models, and whether its AI spending turns into profit has to be checked continuously.
On technology alone, Meta and Google are the closer challengers
These are the Artificial Analysis v4.3.2 results. Each uses the model’s high-performance setting, and this is not a same-cost test.2
| Model | Intelligence index | Cost per evaluation task |
|---|---|---|
| Meta Muse Wonder Full | 56 | not shown |
| Google Gemini 4 Argon | 53 | $1.99 |
| Meta Muse Wonder | 52 | $4.54 |
| SpaceXAI Grok 4.7 | 46 | $3.74 |
Meta’s top score of 56 is the best result among the three companies whose scores we checked: Meta, Google and SpaceXAI. We have not compared equivalent latest own models from Microsoft, Amazon or Oracle, so that comparison is incomplete. We also separated the ability to sell outside models from the ability to do own research.
On people and research, three things stand out: the breadth of Google DeepMind and the TPU organization, Meta MSL’s recent model progress, and the pairing of Microsoft Research and MAI with Azure. A TPU is Google’s own AI chip.
We did not rank on paper counts alone. The Gemini technical report, Llama research and Phi-4 report show accumulated research. They are separate from current product results.345
In finance, cash left after investing separates the companies more than growth does
Units are billions of US dollars. We used the latest reported quarter, so quarter-ends differ by company. Simple FCF is operating cash flow minus cash capex.
| Company | Quarter end | Revenue growth | Simple FCF |
|---|---|---|---|
| Microsoft | June | +18% | +19.64 |
| June | +24% | −5.86 | |
| Meta | September | +26% | −1.16 |
| Amazon | June | +20% | −8.82 |
| SpaceX | September | +161% | −9.96 |
| Oracle | August | +30% | −5.40 |
Oracle (30%) and SpaceX (161%) grow revenue faster. But Microsoft is the only one with positive cash after paying for investment. The chart below shows the same numbers as bars.
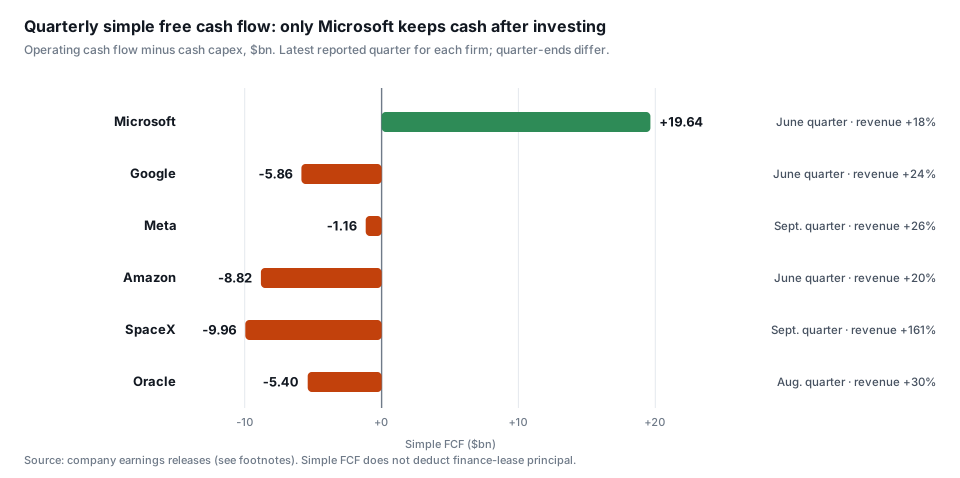
The readings differ by company, and the differences matter:
- Google: Free cash flow was negative in the latest quarter. But trailing twelve-month FCF at the end of June was $53.3 billion, and $242.5 billion of cash and securities is a large cushion. Cash raised from financing must be kept apart from cash created by operations.6
- Meta: Excluding $9.89 billion of legal costs, operating margin is 35.4%. That is not a collapse of the core business, but it is below 40.1% a year earlier. Company-defined free cash flow after finance-lease principal is −$2.12 billion, lower than the simple FCF in the table (−$1.16 billion).7
- Amazon: AWS grew 37% and earned $16.6 billion of operating income. But consolidated capex also includes logistics. Total investment burden and AWS economics should be read separately.8
- SpaceX: The Superintelligence (SI) business is already about 52% of quarterly revenue. Classifying it as a space company alone misses the current business. Its large cash balance also reflects the IPO and financing, and its investment spending is large.9
- Oracle: Infrastructure cloud (IaaS) grew 121%. But operating cash flow includes a $11.36 billion rise in customer prepayments, and these carry a significant financing component (they work as financing through payment timing). Backlog and prepayments do not guarantee a long-term return on the investment.10
On credit quality, the evidence for Microsoft’s AAA/Aaa rating is the strongest. For some of the others, the rating data we hold is old, so a full comparison of current ratings is incomplete.
What the market may under-price is who keeps the profit, not who owns the assets
Who keeps the profit means which company’s revenue and cash the AI profit finally lands in. It is a different question from who owns the most data centers or chips.
| Company | Qualitative strength to watch | Counter-question to check |
|---|---|---|
| Microsoft | A channel that already controls enterprise deployment, security and purchasing | Does more usage turn into more willingness to pay? |
| Vertical integration that captures the cost savings of its own chips | Do supply shortages and Search cannibalization cancel the profit? | |
| Meta | Consumer channels and early compute purchases support fast launches | Can paid retention and inference cost carry the spending and dilution? |
| Amazon | An existing AWS customer base and operating system to sell its own chips into | Is there a real cost advantage large enough to beat switching costs? |
| SpaceX | A launch, connectivity and compute combination rivals cannot easily copy | Does founder-driven execution speed raise the risk of running many projects at once? |
| Oracle | Core enterprise data and large capacity contracts | Does cash remain after customer concentration and prepayments? |
This table is a hypothesis about possible under-pricing. We have no like-for-like valuation and no market expectations, so we do not call any of these companies undervalued.
The share-price trend is also strongest for Microsoft today
The table below sets the October 23 close beside the 200-day moving average and the 14-day RSI. The 200-day line is the average close of the last 200 trading days. RSI measures the strength of recent gains against losses over 14 days and is used to judge overheating or weakness.
| Company | Close ($) | 200-day ($) | RSI 14 | Technical read |
|---|---|---|---|---|
| Microsoft | 524.51 | 436.51 | 52.6 | Medium-term strength. Watch support at 502–508 and a reclaim of 527 |
| Meta | 642.62 | 632.53 | 35.7 | Testing the 200-day line. Support at 632–633; watch a reclaim of 664 |
| Amazon | 248.00 | 243.29 | 43.2 | Pullback above the 200-day line. Needs a reclaim of 254–256 |
| SpaceX | 147.49 | not available | 46.4 | Below the recent 20- and 50-day lines. Watch a reclaim of 149–155 |
| 320.21 | 341.31 | 31.3 | Below the main moving averages. Needs a reclaim of 341–343 | |
| Oracle | 126.16 | 158.55 | 39.1 | Long-term weakness. Watch a reclaim of 136 and 143 |
The gap is the close divided by the 200-day average, minus one. Microsoft is 524.51 ÷ 436.51 − 1 = +20.2%, the furthest above its 200-day line. Google is −6.2% and Oracle −20.4%.
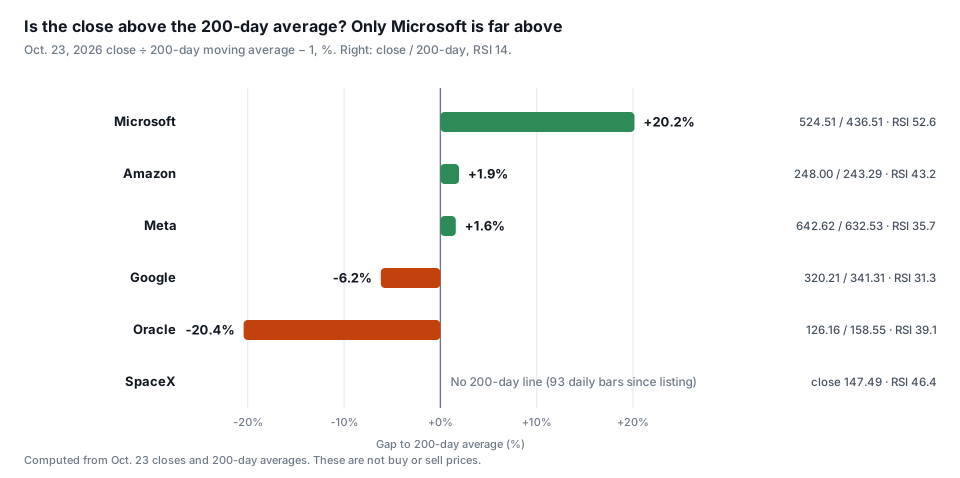
Microsoft’s 63-trading-day return is +35.1%, which is 31.7 percentage points ahead of QQQ. SpaceX listed in June as SPCX and has only 93 daily bars, so it has no 200-day line. The watch zones in the table are not order prices.11
The question that could reverse the ranking is whether Google and Meta turn technical progress into cash after investing
Google and Meta threaten Microsoft on technology and models. But cash after investment is negative for both today. If that gap closes, the ranking can change.
The next checkpoints are Microsoft’s results on October 28 (US time) and Amazon’s on October 29.
Interest note: This analysis was drafted with an OpenAI model, and Anthropic’s Claude was used to edit it for publication. Some of the companies compared have business relationships with these two AI companies. We cite public figures only and make no judgment about any single company’s exposure.
Disclaimer: For research and information purposes only. Not investment advice. Names cited are for analytical illustration; readers should perform their own due diligence and consult licensed advisors before any investment decision.
Microsoft fiscal 2026 fourth-quarter results. The $67.0 billion is our simple calculation: $182.9 billion − $115.9 billion. ↩︎
Artificial Analysis model releases, v4.3.2. Scores use each model’s high-performance setting and are not a same-cost test. ↩︎
Our calculation from October 23, 2026 closes and daily bars. The 63-trading-day return and the excess return over QQQ use the same daily data. SpaceX (SPCX) has 93 daily bars, so no 200-day line. ↩︎