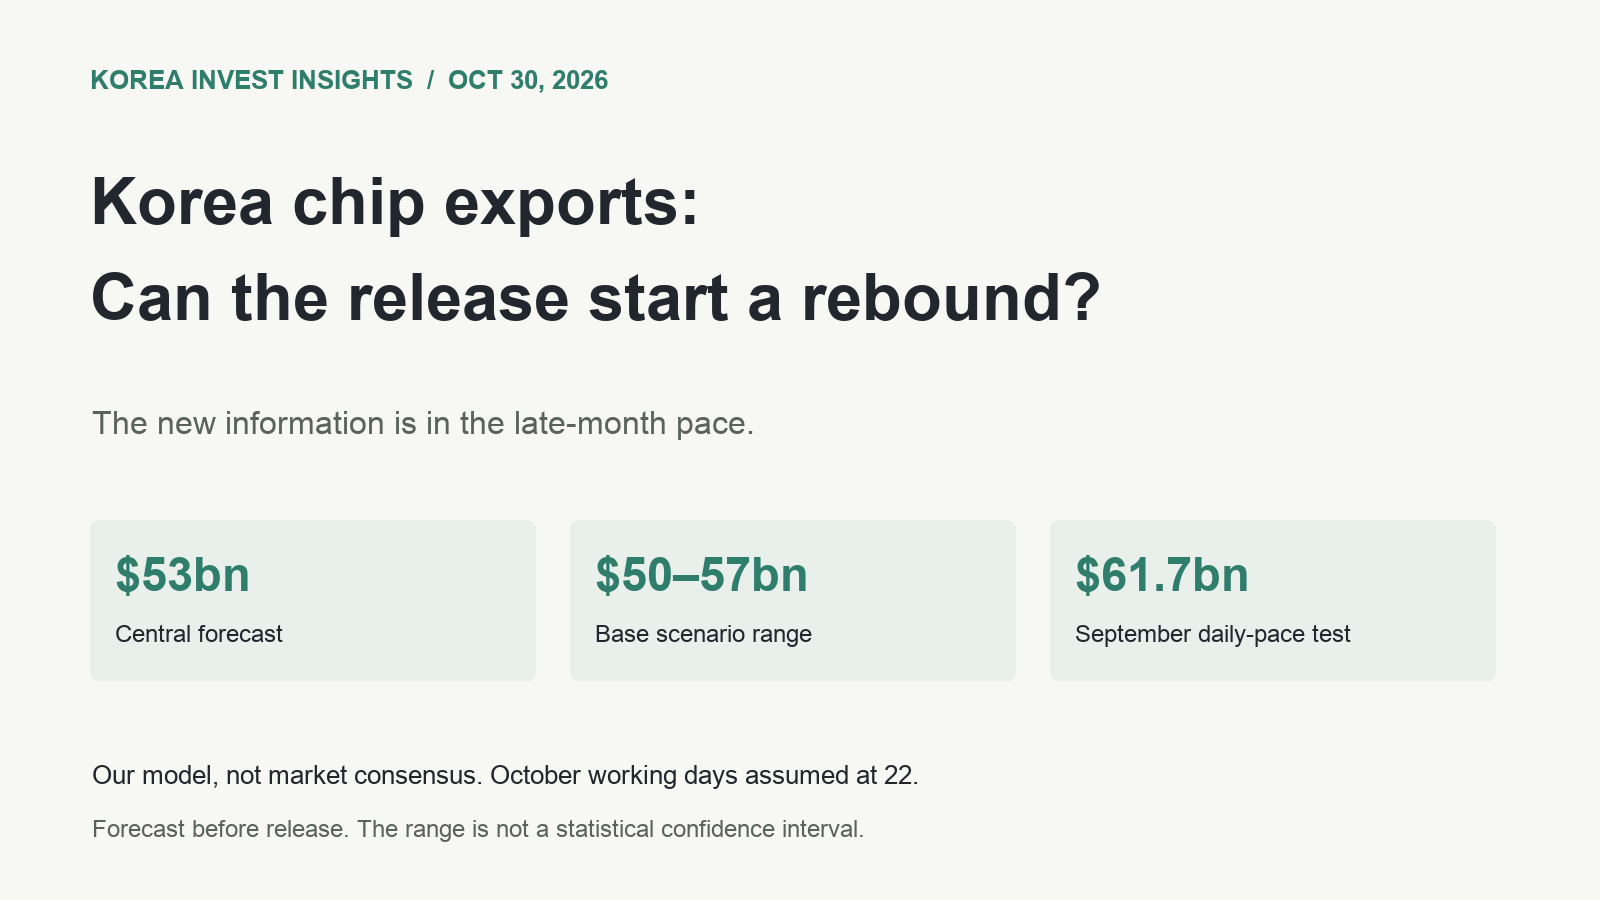
I expect Korea’s October semiconductor exports to be about $53 billion, within a base range of $50–57 billion. That would be roughly 12% below September but 238% above the previous October. This is my forecast before the release, not a reported result or market consensus.
The early-November export release could catalyze a rebound in Korean semiconductor shares. It can show that higher prices are turning into export receipts and that shipments held up late in the month. But a headline of more than 200% yearly growth is not enough new information: growth through October 20 was already 222.5%.
My first constructive reference point is $58 billion, above the base range. The stronger test is approximately $62 billion. Assuming 22 working days in October, that would also maintain September’s daily export pace. These are analytical reference points, not thresholds that guarantee a share-price rally.
As of October 30, 2026. This previews October trade data expected around November 1. I have not verified the official time for this particular release; Customs and the trade ministry can publish on different dates. November 1 is a Sunday, so equity-market confirmation would come from November 2 onward, depending on publication timing.
Yearly growth is strong. The recent daily pace is softer.
Korea Customs Service reported semiconductor exports of $27.516 billion for October 1–20, versus $34.128 billion for September 1–20. That is a 19.4% decline in total value. Working days also fell from 15.5 to 13, making the raw decline a poor measure of demand. October Customs PDF, September Customs PDF
| First 20 calendar days | Chip exports, $bn | Working days | $bn per working day |
|---|---|---|---|
| July 2026 | 22.113 | 14.5 | 1.525 |
| August 2026 | 26.032 | 14.0 | 1.859 |
| September 2026 | 34.128 | 15.5 | 2.202 |
| October 2026 | 27.516 | 13.0 | 2.117 |
Sources: Customs July, August, and the September/October provisional releases above. Daily values are calculated. This is the Customs semiconductor commodity category, not HBM alone.
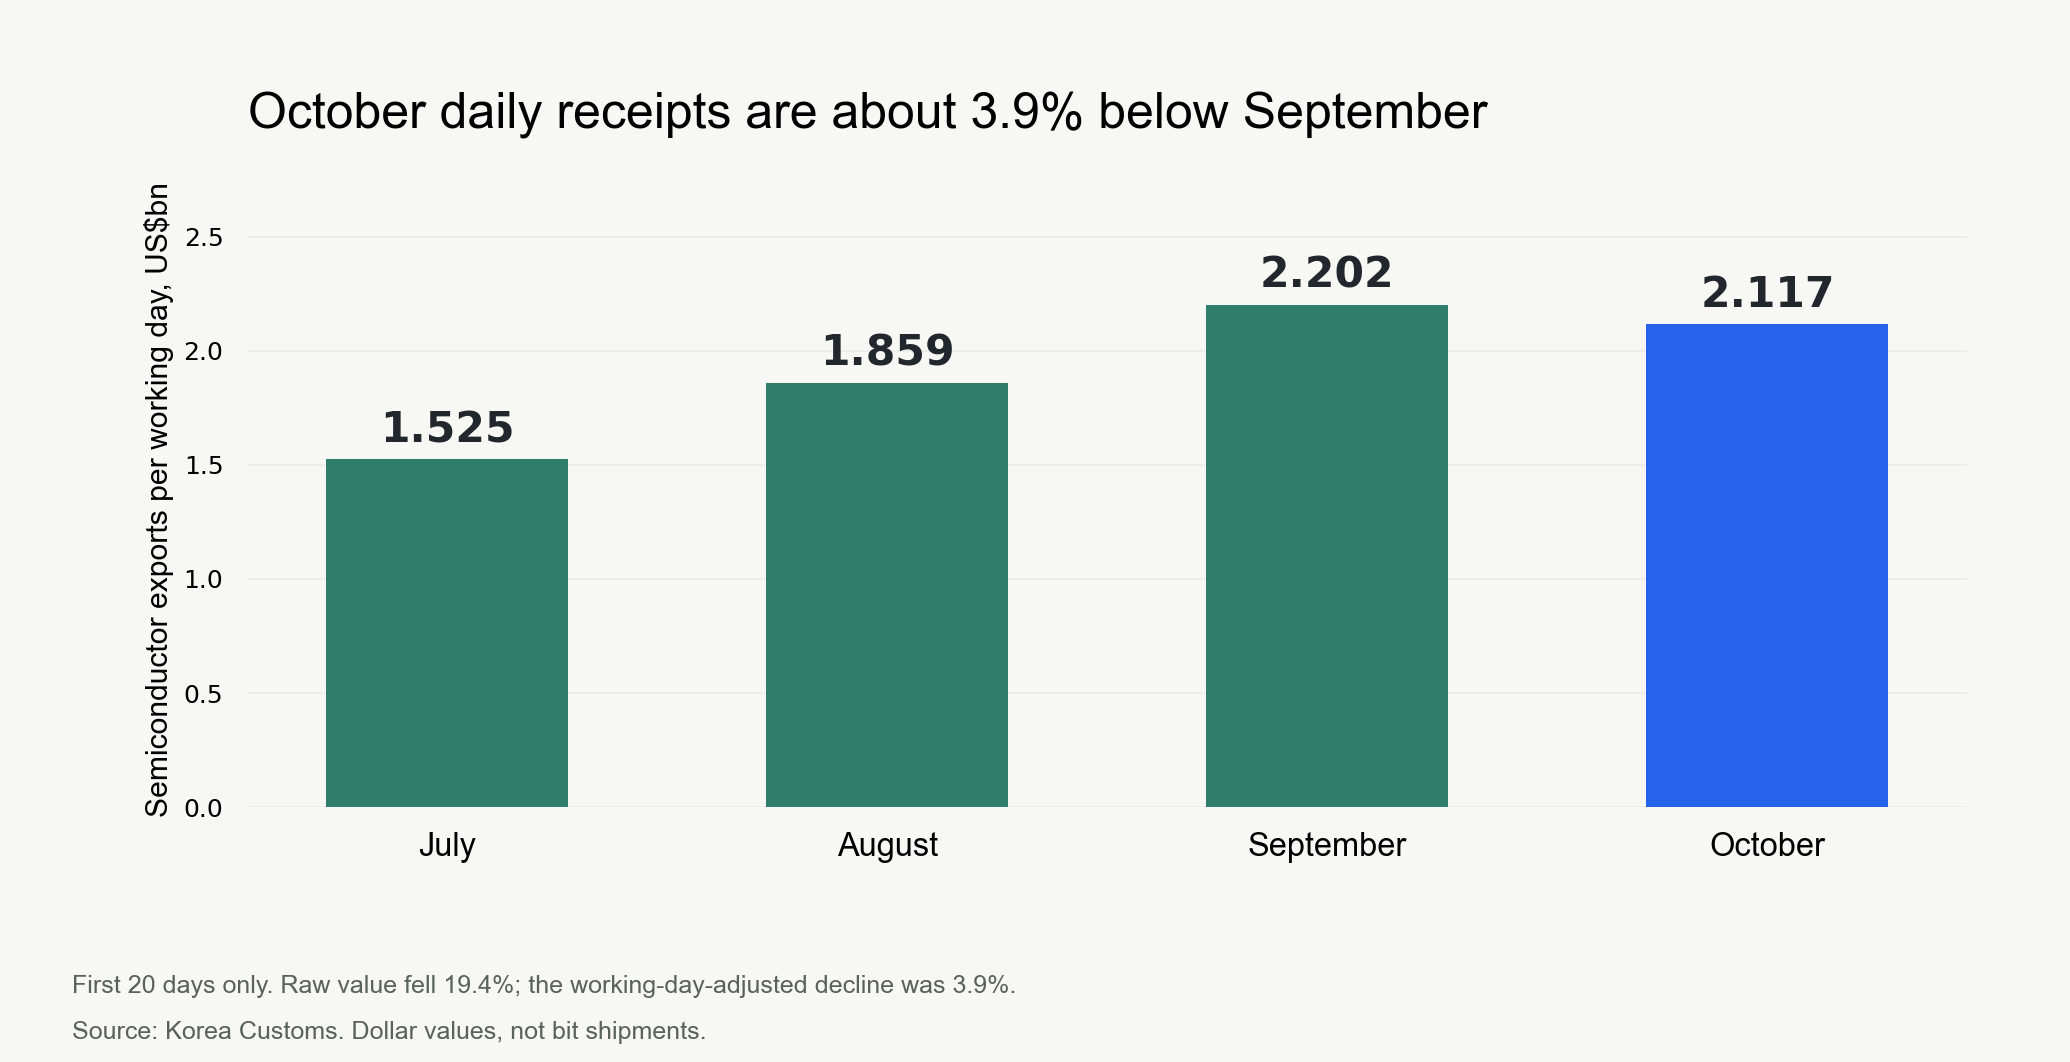
After adjusting for working days, the sequential decline is about 3.9%. That is much less alarming than 19.4%, but it also does not establish continued acceleration. These are dollar values, not bit shipments. Prices, product mix and quantity cannot be separated from this aggregate alone.
The $53 billion forecast assumes a 35% late-month uplift
Extending the observed daily rate across October would produce only about $46.6 billion. A forecast should also consider the concentration of customs clearance and export recognition toward month-end.
The model, in US$ billions, is:
October = 27.516 + (27.516 / 13) × 9 remaining working days × 1.35 late-month multiplier
Calculated result: $53.23bn. Rounded central forecast: $53bn.
The remaining nine working days are an explicit assumption: eight weekdays plus two Saturdays counted at half a day each, from October 21–31. Added to the official first-period count of 13, that gives 22. The final release must be checked against this count. A one-day change moves the base estimate by about $2.86 billion.
The 1.35 multiplier is grounded in two recent non-quarter-end months. Bridging Customs’ interim numbers to the ministry’s monthly semiconductor totals implies a remaining-period daily rate about 30% higher in July and 39% higher in August. I use 35% between those observations. September’s implied uplift was much larger, about 98%. Repeating that concentration would produce about $65.2 billion for October. Monthly totals and prior-year base: ministry September release, page 20
This bridge has a limitation: Customs’ interim commodity classification and the ministry’s major-export-product classification are not guaranteed to be identical. Classification and provisional-data revisions may enter the multiplier. It is an approximation linking releases, not a pure physical shipment-rate estimate. Two calibration months do not make a statistically validated forecasting model.
| Assumption | Late-month multiplier | October exports | Interpretation |
|---|---|---|---|
| No extra concentration | 1.00x | $46.6bn | Observed daily pace continues |
| Base | 1.35x | $53.2bn | Reference: July and August |
| September-style concentration | About 1.98x | $65.2bn | Upside sensitivity, not the base case |
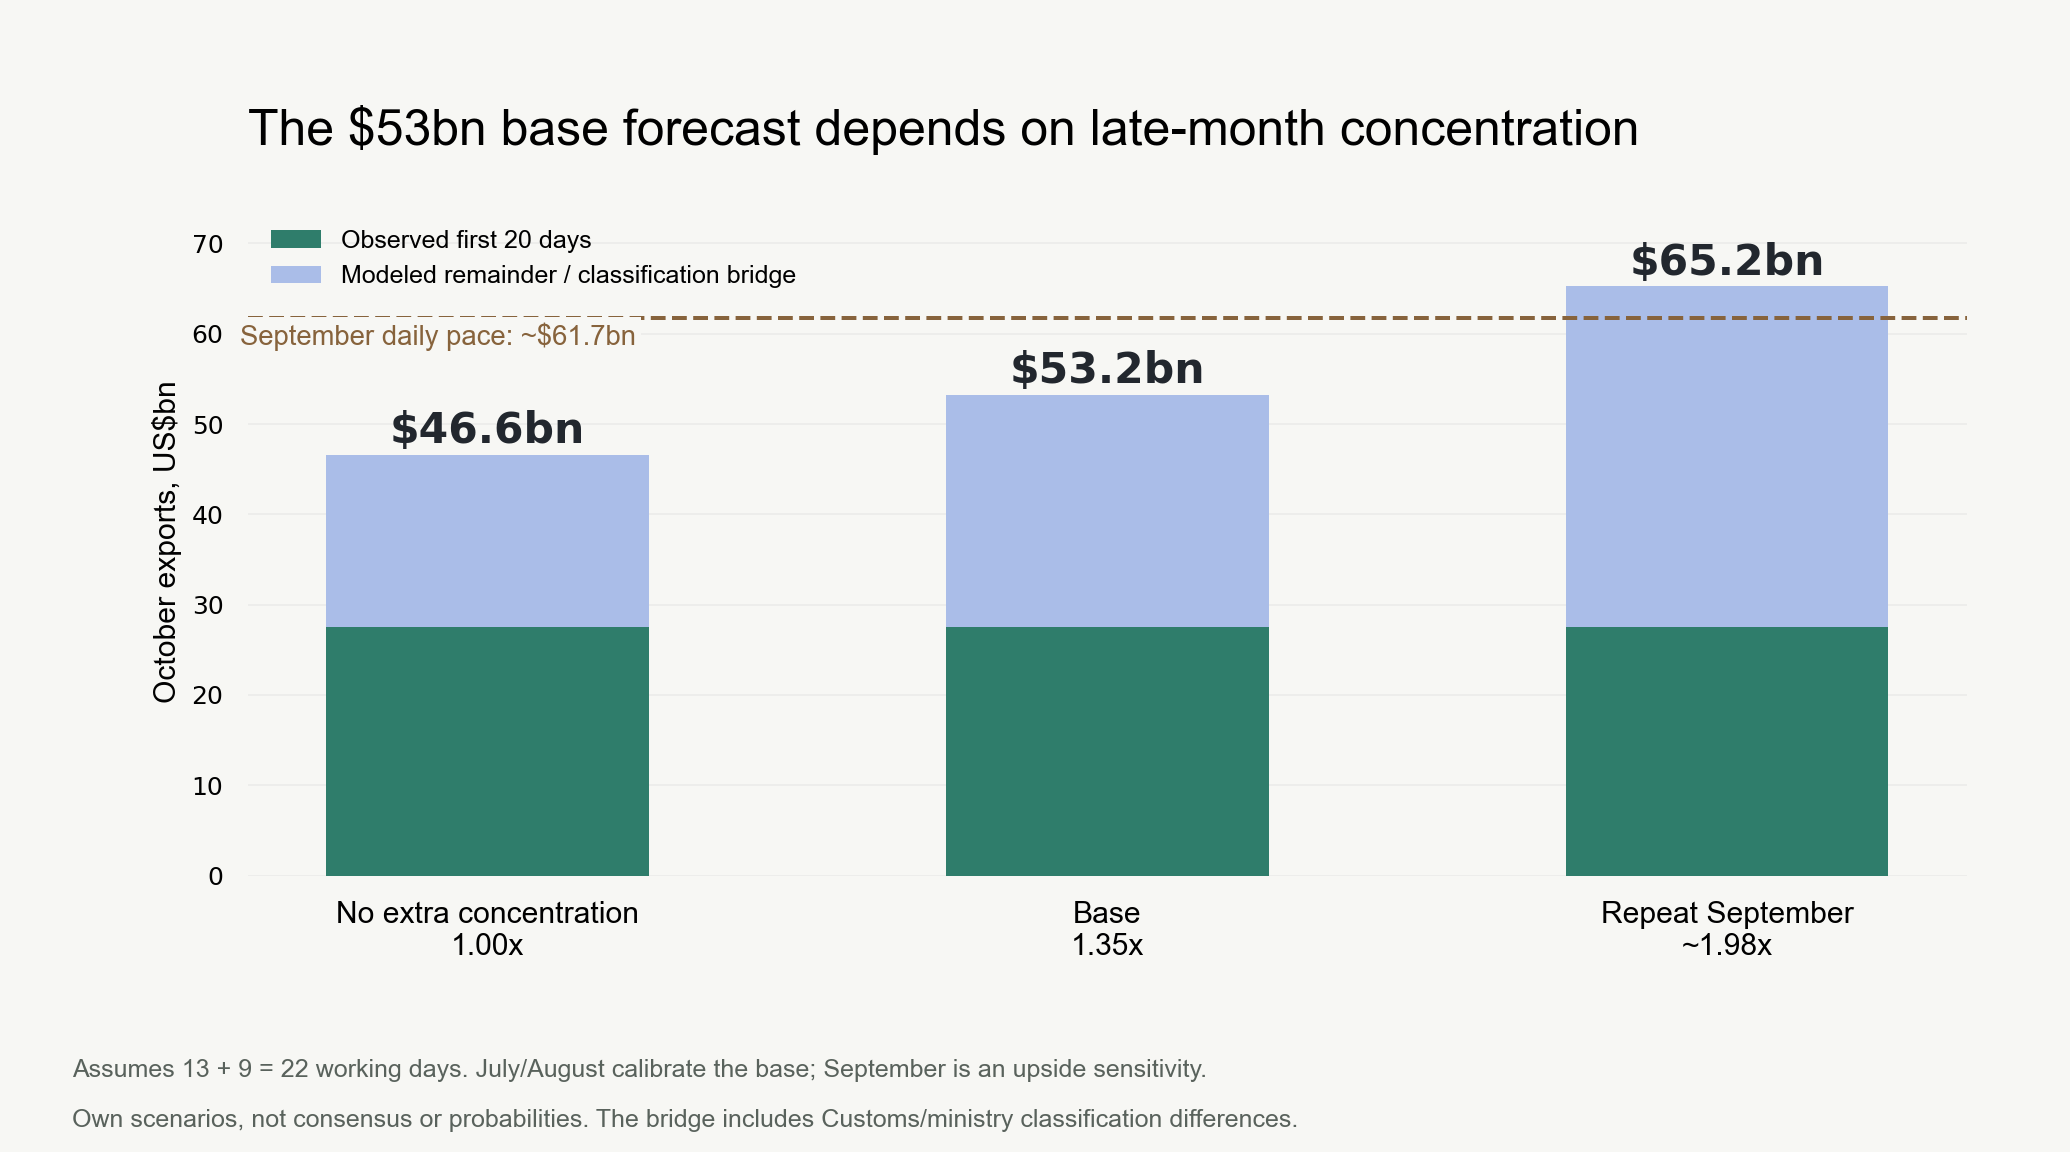
Multipliers of 1.20–1.55 yield about $50.4–57.0 billion, rounded to a $50–57 billion base range. This is not a confidence interval or probability distribution. A repeat of September’s concentration could exceed it substantially.
DRAM prices support the case. They are not an extra export multiplier.
The supplied SK Securities research summary describes further Q4 PC DRAM price increases, at a slower rate. TrendForce’s October 30 public abstract also describes continued increases, some negotiations moving into November, weaker notebook demand and rising buyer inventories. I could not independently reconcile the detailed prices or the cited 13–18% quarterly increase against the paywalled full report. It should not be presented as a fully settled quarter. TrendForce October contract-price abstract
These selected figures are arithmetic checks on the supplied memo, not independently verified primary price observations.
| Product | September → October, US$ | Calculated change |
|---|---|---|
| DDR5 16GB module | 247 → 275 | +11.3% |
| DDR4 8GB module | 148 → 170 | +14.9% |
| DDR5 16Gb chip | 48 → 50 | +4.2% |
| DDR4 8Gb chip | 26 → 27.5 | +5.8% |
Source: user-supplied TrendForce summary attributed to SK Securities’ semiconductor and overseas-equity research team; research channel. GB module capacity and Gb chip capacity are different units; transaction terms are not assumed identical.
Multiplying September’s entire chip exports by a PC-memory price increase would be a mistake. Korean semiconductor exports include server memory, HBM, NAND and non-memory products. October’s observed export value already incorporates prices and mix through October 20. Applying another broad DRAM uplift to this model could partly double-count the same effect.
The claimed narrowing of the DDR5 discount also depends on the SKU. Using the supplied monthly prices, 8GB DDR5’s discount to DDR4 narrows from 10.1% to 2.9%; at 16GB it widens from 10.2% to 11.3%. The memo’s separate Q3-average figure of 6% could not be reconciled to a verified quarterly denominator. One product and one measurement window cannot represent the entire DDR5 market.
Spot prices are not uniformly rising either. The October 30 public board shows some DDR5 items up and some DDR4 items flat or down. A separate Specialty DRAM abstract discusses spot prices retreating from peaks. Product segments and contract/spot series must remain distinct. Public price board, Specialty DRAM abstract
$58 billion would beat this model. $62 billion would answer a harder question.
The useful surprise is evidence against recent deceleration, rather than another large annual growth headline. I have not obtained a formal market consensus for semiconductor exports. This table compares the release with my own model.
| Reported result | My interpretation | Rebound relevance |
|---|---|---|
| Below $50bn | Below the base range; weak late-month recovery is possible | Exports alone offer limited support |
| $50–57bn | Strong yearly growth alongside a sequential slowdown | Confirmation; could support an oversold argument |
| $58bn or more | Above the base range; better late-month receipts than assumed | A plausible short-run catalyst |
| About $62bn or more | Also maintains/exceeds September’s daily pace on a 22-day assumption | Stronger evidence against recent deceleration |
These are rounded reference points on a continuous scale, not mechanical boundaries. There is no special cliff between $57 billion and $58 billion, and the $62 billion case also satisfies the $58 billion condition.
September’s monthly semiconductor exports were $60.295 billion over 21.5 working days. Matching that daily pace over 22 October working days requires about $61.7 billion. A small new monthly record above $60.3 billion could therefore coexist with a lower daily pace.
Shares could rebound around $53 billion if investors had priced in greater damage. They could also fall after $62 billion if rates, currencies, US chip stocks or forced selling dominate. On the first session after the release, I would look for semiconductor relative strength, retention of early gains and easing foreign-investor selling. Those observations would strengthen the link between a good physical-data release and actual buying.
Strong exports do not settle the buyer-inventory debate
The strongest counterargument concerns where the memory goes after customs. Export value does not tell us whether a customer installed the chips in servers or placed them in inventory. Purchases pulled forward by fear of higher prices can raise today’s exports while borrowing from future orders.
TrendForce has discussed inventory accumulation alongside PC demand pressure. A strong October release and concern about future buyer inventories can both be valid. TrendForce’s September outlook, our earlier buyer-inventory analysis
My assessment leaves room for a short-term rebound. It does not turn one export release into proof of 2027–2028 final demand, lasting supply shortages, or company-specific shipments at Samsung and SK hynix. Memory/non-memory details, subsequent customs data and customer inventories remain the follow-through tests.
If the number is $53 billion, would you emphasize “still exceptionally strong” or “weaker than September”? Leave the export figure that would change your view, and why. I will look for both a result above the base range and evidence that buyers respond.
Forecast frozen using information available on October 30. The base range is not a statistical confidence interval or an individualized trading recommendation. Publication timing, working-day assumptions, classification and revisions can change the calculation.