Context: this article follows our work on H1 2026 AI infrastructure bottlenecks and narrow leadership, Samsung Electronics’ post-earnings selloff and the NVIDIA precedent, SK hynix ADR and leveraged-ETF plumbing, and late-July big-tech earnings scenarios for the memory thesis. The purpose is to separate long-term AI demand from short-term price mechanics.
TL;DR
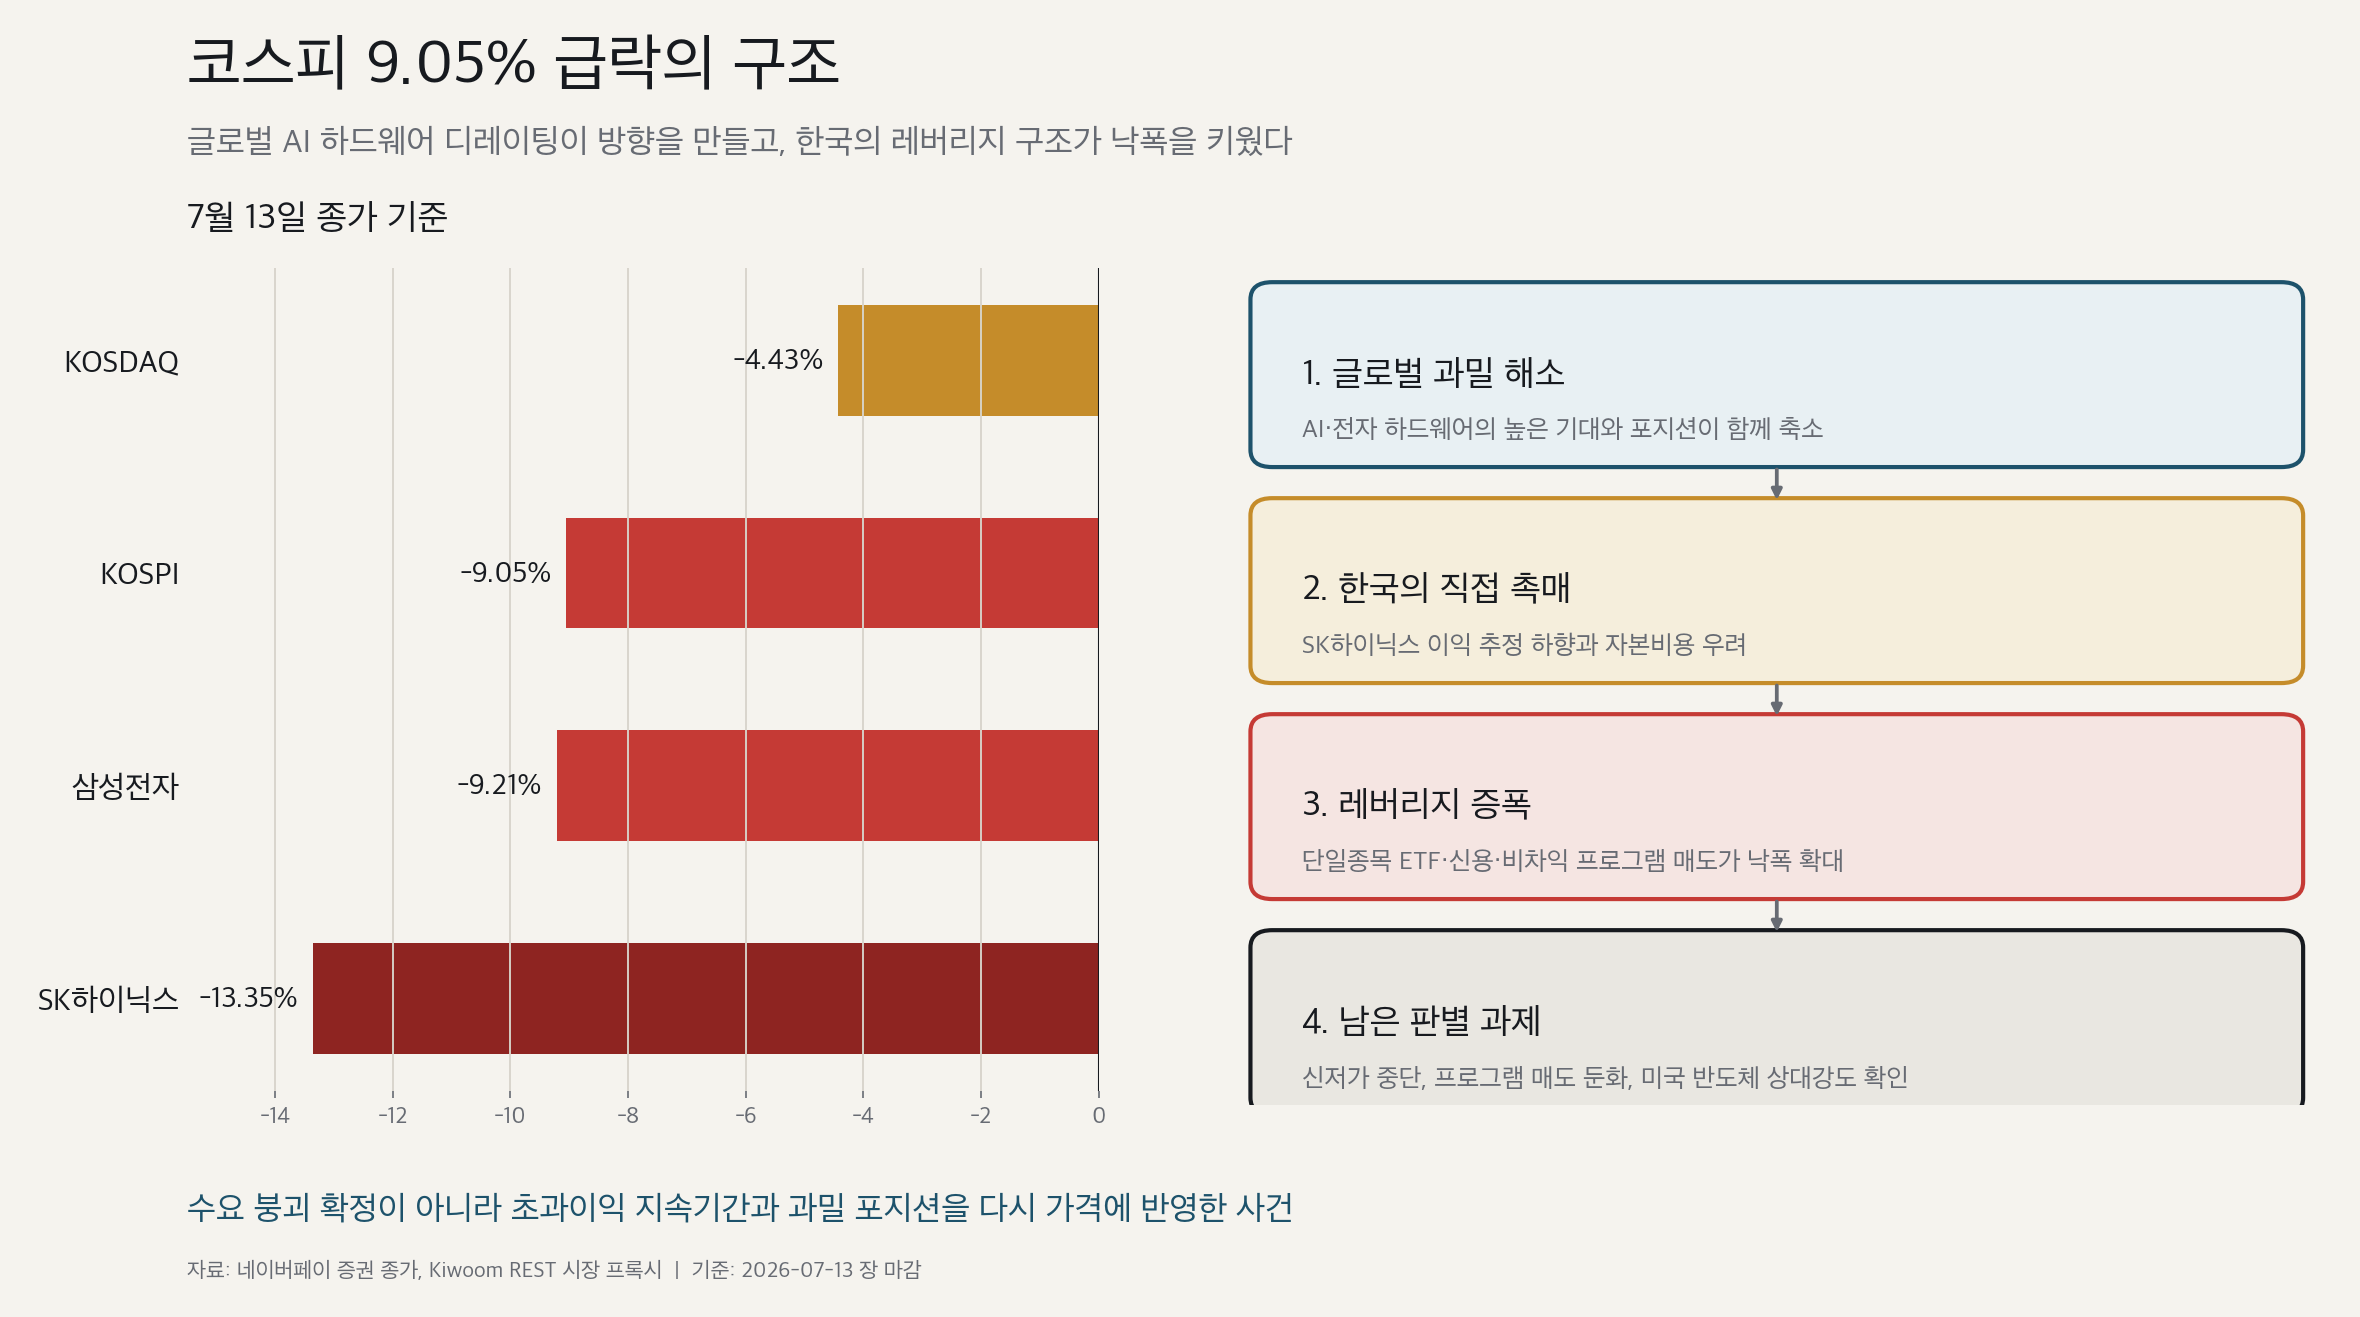
- On July 13, 2026, KOSPI closed at 6,799.24, down 9.05%. KOSDAQ fell 4.43% to 800.35. Samsung Electronics lost 9.21% to KRW 258,750 and SK hynix fell 13.35% to KRW 1,889,000.
- A Korea-only market-plumbing accident does not explain the full move. Japanese NAND, MLCC and FC-BGA names also sold off sharply. The best causal frame is that a global unwind in crowded AI and electronics hardware set the direction, while Korea’s leveraged ETFs, margin exposure and program trading magnified the decline.
- The evidence does not establish a collapse in physical AI demand. TSMC reported record June revenue, while early-July memory exports and long-term HBM supply evidence still point to strong demand. Strong demand, however, does not automatically protect an elevated earnings path or valuation multiple.
- The neutral reading is that deleveraging has started but completion is unconfirmed. A durable bottom requires fewer new lows, weaker program selling, a decline in leveraged-ETF and margin exposure, and improving relative strength in U.S. semiconductors over the next one to three trading days.
1. The closing tape
Intraday screens showed KOSPI near 6,803, Samsung Electronics at KRW 254,500 and SK hynix at KRW 1,847,000. A market report should start with closing data rather than intraday lows.
| Asset | July 13 close | Daily return | Data type |
|---|---|---|---|
| KOSPI | 6,799.24 | -9.05% | Naver Finance 15:30 close |
| KOSDAQ | 800.35 | -4.43% | Naver Finance 15:30 close |
| Samsung Electronics | KRW 258,750 | -9.21% | Kiwoom REST daily bar |
| SK hynix | KRW 1,889,000 | -13.35% | Kiwoom REST daily bar |
The index closes can be checked on the KOSPI and KOSDAQ pages.
Program trading played a direct role. The Kiwoom market proxy recorded approximately KRW 2.14 trillion of net program selling. Arbitrage flows were about KRW 172 billion net positive, but non-arbitrage flows were approximately KRW 2.31 trillion net negative. The dominant force was therefore broad basket reduction rather than a simple basis trade.
These are Kiwoom REST market proxies, not final KRX official statistics. They are useful for direction and scale but should be superseded when official exchange data are available.
2. A multi-stage causal chain
Middle East, oil, rates and AI-capex funding concerns
  -> global reduction of crowded AI and electronics-hardware exposure
  -> lower SK hynix 2026-2027 earnings estimates become Korea's direct catalyst
  -> selling spreads into Japanese NAND, MLCC and FC-BGA baskets
  -> Korea's index concentration, margin exposure, single-stock leveraged ETFs and program selling magnify losses
  -> positive physical-demand evidence fails to lift prices, triggering further liquidation
| Factor | Role | Confidence | Neutral interpretation |
|---|---|---|---|
| Global AI and electronics hardware unwind | Base direction | High | Japanese NAND, MLCC and FC-BGA names fell together, indicating a factor-level move beyond Korea. |
| Semiconductor leverage liquidation | Korean amplifier | High | Large-cap program selling and leveraged-ETF rebalancing fit the observed nonlinear decline. |
| SK hynix earnings revision | Direct catalyst | High | Long-term demand remained constructive, but near-term earnings and the 2026-2027 trajectory were reduced. |
| Oil, rates and geopolitical risk | Macro trigger | Medium-high | These explain higher discount rates and risk aversion but not Korea’s full relative loss. |
| AI capex funding cost | Multiple pressure | Medium | Capital costs may separate cash-rich investors from more leveraged infrastructure spenders. |
| Physical AI-demand collapse | Structural bear case | Low | This conflicts with TSMC sales, memory exports, long-term contracts and upstream capacity planning. |
The distinction between cause and amplifier matters. Korea’s leverage structure alone cannot easily explain the synchronized fall in Japanese hardware names. Conversely, the regional unwind alone does not explain why Korea and its two largest memory stocks suffered such extreme losses.
3. A regional shock with a Korean multiplier
Around early afternoon, KOSPI was down roughly 6.8% to 7.2%, while Taiwan was slightly positive, Japan was down around 1.8%, China about 1.5%, and Hong Kong only modestly lower. These were intraday observations, not final closes.
Later, Japanese hardware losses deepened. Intraday screens showed Taiyo Yuden down 18.87%, Yaskawa Electric 14.34%, Kioxia 10.77%, Murata 8.06% and Ibiden 7.39%. The figures are directional observations only.
The common move does not mean every company faced the same fundamental shock. Yaskawa had company-specific execution issues. Kioxia also had concentrated domestic margin exposure. Murata and Taiyo Yuden have significant smartphone and auto exposure, making their declines closer to high-beta electronics selling. Ibiden’s FC-BGA exposure gives it stronger evidentiary value for an AI-hardware derating.
The most coherent decomposition is therefore a global hardware crowding unwind plus a Korean leverage amplifier.
4. Why Korea moved more than Taiwan
Both Korea and Taiwan are semiconductor-heavy, but corporate concentration is not the full story.
| Market | Main H1 driver | Nature of concentration | Vulnerability in a correction |
|---|---|---|---|
| Korea | Memory earnings upgrades, domestic retail and financial-investment flows, margin and leveraged exposure | Corporate, index, derivatives and credit concentration occurred together | Forced selling can become self-reinforcing |
| Taiwan | TSMC earnings credibility and domestic absorption of foreign selling | High corporate concentration but weaker single-stock leverage plumbing | Vulnerable if TSMC earnings confidence breaks |
| Japan | Foreign cash-equity demand, governance reform and multi-sector participation | Leadership spread across semiconductors, banks, trading houses, automation and defense | Yen and global-cycle sensitivity |
Cited industry data indicated that KOSPI margin financing increased from roughly KRW 22.56 trillion to KRW 29.23 trillion during the second quarter, while KOSDAQ margin financing declined from about KRW 10.36 trillion to KRW 8.09 trillion. If confirmed on a consistent basis, this helps explain why KOSPI moved more violently than KOSDAQ. July 13 end-of-day margin balances and forced-liquidation amounts were not yet available.
5. Evidence against a simple AI-demand-collapse thesis
5.1 TSMC June revenue
TSMC’s official monthly revenue data showed June sales of NT$442.68 billion, up 6.2% month over month and 67.9% year over year. Second-quarter revenue was approximately NT$1.270 trillion, up about 12.0% sequentially and 36.1% year over year.
The June comparison benefited from a weak June 2025 base. First-quarter growth of about 35.1% and second-quarter growth of about 36.1% do not show a doubling of the underlying rate. Yet the absolute monthly record and positive monthly and quarterly growth cannot be dismissed as a base effect. This is strong evidence that GPU, ASIC and leading-edge logic demand is converting into revenue. It is only indirect evidence for SK hynix HBM pricing, LTA margins and yields.
5.2 Early-July memory exports
A brokerage interpretation of July 1-10 preliminary trade data showed DRAM export value up roughly 29.4% from the comparable June period, dollar-per-kilogram pricing up 15.7%, and implied volume up about 11.8%. The direction suggests both price and volume improved.
Ten-day preliminary data do not guarantee the full month. Dollars per kilogram are not bit ASP, and the figures cannot be mapped directly to company revenue or operating profit.
5.3 SK hynix LTAs and estimate revisions
A Korea Investment & Securities estimate cited in the press placed second-quarter 2026 operating profit at KRW 60.4 trillion, roughly 8% below a KRW 65 trillion consensus, and cut 2026 and 2027 operating-profit estimates by about 9% and 11%. The same analysis remained constructive on DRAM and NAND pricing and the durability benefits of long-term agreements.
The balanced interpretation is that near-term earnings altitude and revision momentum weakened, while LTAs may support volume visibility and profit floors. Without public price floors, cost pass-through, take-or-pay and renegotiation terms, it is not possible to conclude that LTAs eliminate the memory cycle.
5.4 CPU, wafers and long-term fab plans
Server CPU growth reinforces the idea that AI servers require more than GPUs, broadening bottlenecks into substrates, sockets, BMCs and conventional DRAM. Forecasts such as a US$100 billion server-CPU market by 2028 and a 53% three-year CAGR rely on aggressive assumptions for agentic-AI demand and CPU pricing and should remain scenarios until orders and supplier results confirm them.
Micron and GlobalWafers’ long-term U.S. 300mm wafer agreement, Samsung’s reported Yongin schedule acceleration, and SK’s M15X and Yongin plans show that memory demand is entering upstream procurement and long-term capacity plans. Those fabs ramp mainly from 2027 through 2030, supporting near-term tightness while increasing the risk of margin normalization after 2029.
5.5 HBM through 2030
Some industry work projects HBM demand rising from roughly 4.8EB today to 26.7EB in 2030 versus supply of 10.6EB. The supply forecast appears to incorporate about 2.65 times current capacity, or roughly 21.5% annual growth, rather than assuming no expansion.
The directional case is credible because stacking, leading-edge-node migration, yield, TSV, packaging and inspection constraints prevent wafer input from translating one-for-one into effective bit supply. The exact shortage is highly sensitive to token usage, KV-cache efficiency, mixture-of-experts, quantization and offloading assumptions.
A practical base path is very tight supply through 2027, a growing capacity contribution from 2028, and some broad shortage relief in 2029-2030 while HBM remains structurally tighter than commodity memory.
6. Why strong demand does not guarantee a strong stock
The market is no longer asking only whether AI demand exists. It is asking how long excess profits can last.
- Funding costs: larger AI infrastructure commitments make debt costs and cash-generation differences more important. This implies dispersion among spenders, not necessarily demand disappearance.
- AI inflation: higher memory, power and infrastructure prices help suppliers but can lift inflation, bond yields and customer return hurdles. Earnings can improve while equity multiples contract.
- Profit-duration debate: the key question is whether current margins survive competition, capacity additions and technology shifts.
- Emerging-market index concentration: heavy TSMC, Samsung Electronics and SK hynix weights create benchmark-flow risk independent of corporate earnings. Global investors can stay long AI while diversifying into India, China, energy or utilities.
7. Separating LTAs from a 6x P/B thesis
If LTAs protect volume and price downside, reduce earnings volatility and extend high ROE, higher valuation multiples are theoretically justified. The market, however, observes estimate cuts immediately while treating cycle elimination as an unproven assumption.
| Observable | Still unverified |
|---|---|
| Second-quarter and 2026-2027 estimate changes | LTA floors, cost pass-through, penalties and renegotiation clauses |
| Recent forecast errors and ASP expectations | HBM4 yields, packaging cost and realized premium |
| A target-price formula using forward book value | Long-duration exceptional ROE and the disappearance of downcycles |
Applying a 12-month forward book value of KRW 643,124 mechanically gives about KRW 1.93 million at 3x P/B and KRW 3.86 million at 6x. The difference reflects profit duration and risk more than a few trillion won of quarterly earnings.
At zero growth and a 10% cost of equity, a simplified residual-income identity links 3x and 6x P/B to sustainable ROEs of roughly 30% and 60%. With 4% growth, the implied ROEs fall to about 22% and 40%. This is an explanatory sensitivity, not a precise valuation. A 6x multiple requires large excess profits, long duration and structurally lower risk at the same time.
8. Single-stock leveraged ETFs and short-gamma plumbing
Market estimates suggested that single-stock leveraged-ETF assets fell from about KRW 17.4 trillion on June 25 to KRW 11.6 trillion on July 8. A modeled additional 5% shock implied sensitivities of roughly KRW 2.65 trillion for SK hynix and KRW 1.49 trillion for Samsung Electronics. These were modeled exposures, not actual sell orders.
Share-price decline
  -> lower leveraged-ETF NAV
  -> underlying sales to restore target leverage
  -> further price decline
  -> more program selling and margin liquidation
  -> another round of underlying sales
The July 13 shock may mark the beginning of normalization because it mechanically reduced leverage. It does not prove completion because end-of-day ETF assets, margin balances and forced-liquidation data were unavailable. Japan’s hardware selloff also shows that leverage was an amplifier rather than the sole root cause.
Reported regulatory discussions indicate recognition of the structural risk. Restricting new products could reduce medium-term fragility, but forced conversion, leverage cuts or liquidation of existing products could create a second round of short-term selling. New-product policy and legacy-product treatment must be separated.
9. What strengthened, weakened and remains unknown
Strengthened
- AI infrastructure demand is broadening from GPUs and HBM into CPUs, conventional DRAM, wafers, substrates and power networks.
- Limited 2027 commodity-memory capacity and possible LTA prioritization support memory pricing and profit duration.
- Early-July DRAM data suggest simultaneous improvement in price and shipments.
- Long-term fab schedules and upstream contracts indicate demand is being incorporated into plans beyond 2029.
Weakened
- The assumption that good earnings and capex news immediately lift share prices.
- The claim that a low forward P/E automatically defines a bottom.
- The view that an SK hynix ADR premium creates a risk-free rerating of the Korean ordinary share.
- Confidence in any specific short-term price floor.
- The claim that LTAs alone eliminate the memory cycle and immediately justify 6x P/B.
- The idea that the selloff was an isolated Korean leveraged-ETF accident.
Unknown
- Whether July 13 was the final leverage-liquidation low.
- How much LTAs change actual margin floors and pricing upside.
- Whether late-July big-tech AI spending is maintained or raised.
- How strongly post-2029 capacity normalizes excess margins.
10. Scenario map
| Scenario | Confirmation conditions | Interpretation |
|---|---|---|
| Bull: flow-driven capitulation | New lows stop, program selling collapses, ETF assets and margin exposure fall, foreign cash buying returns | Deleveraging gives way to a higher-quality rebound |
| Base: volatile bottom-building | Program selling slows but cash buying remains weak, new lows alternate with rebounds, markets await CPI, ASML and TSMC | Liquidation continues and the low is unconfirmed |
| Bear: structural repricing | New lows despite constructive CPI, ASML and TSMC; big-tech capex slows; estimates fall in sequence; SK hynix lacks relative strength | Both 2027 earnings and justified P/B move lower |
The most important test is whether prices begin to rise on good news. A change in reaction function is more direct bottom evidence than the optimism of the headline itself.
| U.S. semiconductor response | Interpretation |
|---|---|
| SOX outperforms Nasdaq 100 and MU, NVDA, AVGO, AMAT and LRCX reclaim lows | Asia over-discounted the risk and Korean leverage was a major amplifier |
| SOX falls 3% to 5% with memory, equipment and substrates weak together | A global AI-hardware multiple correction is confirmed |
| Leveraged AI-infrastructure spenders fall while cash-rich big tech and semis defend | Funding-capacity differentiation, not broad AI-demand collapse |
11. What to monitor next
- The next one to three trading days: new lows, volatility, volume and program-selling intensity.
- Confirmed single-stock ETF assets, margin balances, forced liquidation and foreign cash flows.
- Hormuz traffic, insurance costs, WTI, the U.S. 10-year yield and USD/KRW.
- SOX and the relative strength of MU, NVDA, AVGO, AMAT and LRCX.
- July 14 U.S. CPI composition and the joint response of rates, oil and semiconductors.
- TSMC’s July 16 guidance, AI-accelerator demand, CoWoS constraints and capex.
- Late-July AI capex, AI revenue, free cash flow and funding pressure at Microsoft, Meta, Alphabet and Amazon.
- Third-quarter SK hynix HBM4 shipments, yields, ASPs and LTA effects, plus Samsung’s HBM qualification and AI5 foundry ramp.
- The distinction between restrictions on new single-stock leveraged ETFs and treatment of existing products.
12. Evidence boundary
| Evidence level | Inputs | Use |
|---|---|---|
| High | Closing prices, Kiwoom daily bars, official TSMC monthly sales and company releases | Establish facts and direction; do not automatically map into supplier earnings |
| Medium | Brokerage estimates and major financial-media reporting | Forecasts and market interpretation, separated from company facts |
| Limited | Intraday screens, program proxies and ten-day export data | Directional signals requiring official close and full-period confirmation |
| Hypothesis | Confidential LTA terms, 6x P/B assumptions, bottom and regulatory effects | Scenario analysis only; insufficient to change a thesis alone |
Conclusion
The July 13 decline was neither a Korea-only market-plumbing accident nor proof that physical AI demand disappeared. A global reduction in crowded AI and electronics-hardware exposure set the direction. Lower SK hynix estimates and funding-cost concerns provided direct catalysts, while Korea’s leveraged ETFs, margin exposure and program selling magnified the decline.
Record TSMC monthly revenue, preliminary memory exports and long-term HBM supply evidence indicate that demand remains alive. The market is nevertheless demanding a higher standard of proof: how long profits last, whether LTAs protect margins, whether AI capex can be funded from cash flow, and how much crowded exposure has actually been removed.
The next conclusion will come from price behavior rather than the number of optimistic headlines. U.S. semiconductor confirmation, the response to CPI and TSMC, a return of foreign cash buying and weaker Korean program selling will determine whether this was a leverage reset or the start of a deeper structural repricing.
Data cutoff: Korea’s July 13, 2026 close. Program and selected flow figures are Kiwoom REST proxies pending official KRX confirmation. This article is market-structure research for informational purposes and is not a recommendation to buy or sell any security.