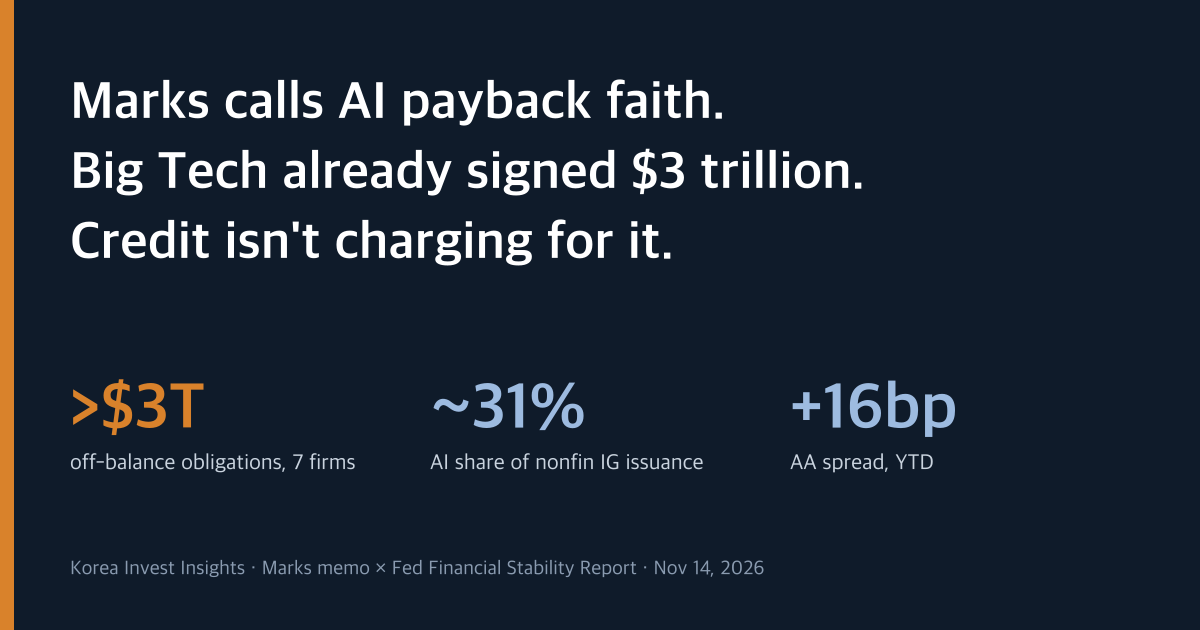
In his November 11 memo, Howard Marks wrote that whether AI spending pays off is, for now, largely “a matter of faith.” Nobody knows if users will get enough value to repay trillions of dollars of investment, or which companies will collect it.
Two days later the Federal Reserve published its November Financial Stability Report. Where Marks left questions, the Fed put numbers. Seven companies (Amazon, Alphabet, Broadcom, Meta, Microsoft, Nvidia and Oracle) now carry off-balance-sheet obligations of more than $3 trillion, undiscounted. That is three years of the $1 trillion of new capital Marks thinks AI needs every year.
Put the two documents together and one picture appears. The market did not wait for the answer. It has already signed the contracts. Equity investors have taken some discount for that uncertainty. Credit investors have not.
Our view: the Fed filled in the funding half of Marks’s questions with numbers. Neither document answers the demand half: will users pay enough to earn back the spending. Today the place where AI risk is priced least is not AI stocks but AI corporate bonds. The first signal that would change our view is an AA spread of 75bp or a high-yield spread of 350bp. On November 11 they stood at 65bp and 330bp.
- The seven firms’ off-balance-sheet obligations were about equal to their balance-sheet debt in 2024. By the second quarter of 2026 they were more than 3.4 times as large. An option to wait turned into a contract in eighteen months.
- AI-related debt issuance passed $680 billion by October, about 31% of nonfinancial investment-grade issuance. Investment-grade spreads barely moved over the same period.
- The subordinated risk in the least predictable layers (neoclouds, frontier labs) sits with high-yield funds, life insurers and BDCs. Life insurer leverage is at a historic high, and BDCs are seeing net outflows.
- In the fall, 87% of surveyed market participants named AI as a top risk, while hedge fund leverage hit its highest level since data began in 2013. The first shock is more likely to hit share prices than bonds.
- Next checks: Nvidia’s results on November 18 and AA and high-yield spreads around the December 10 FOMC.
The Fed filled in only “who bet how much”
Marks built his memo as a layman’s list of questions. The Fed report answers the funding questions almost one for one. Two independent sources, the chairman of a credit manager and the bank supervisor, point to the same structure.
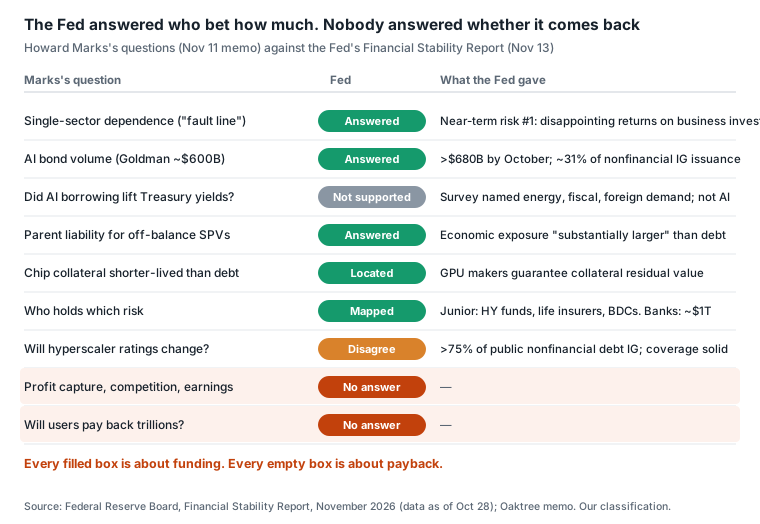
Read the chart down the right-hand side and a rule appears. Every box the Fed filled is about who bet how much. Every box left empty is about whether the money comes back. The funding map is now sharp. The payback map is exactly as Marks left it.
One box does not support Marks. He suspected that hyperscaler borrowing helped push up government bond yields. When the Fed’s survey respondents named the drivers of higher long-term rates, they listed energy prices, fiscal policy and weaker foreign demand. AI borrowing was not on the list. The idea remains unproven.
Faith has already become a contract
Marks offers investors a set of checks. The second one is: how much do you lose if a key assumption is wrong? The data center box in the Fed report gives the frame for an answer.
The seven firms are bound by more than $1 trillion of leases that have not yet started, and by more than $2 trillion of take-or-pay contracts (pay whether you use it or not) and residual value guarantees. These payments stay due even if demand falls short.
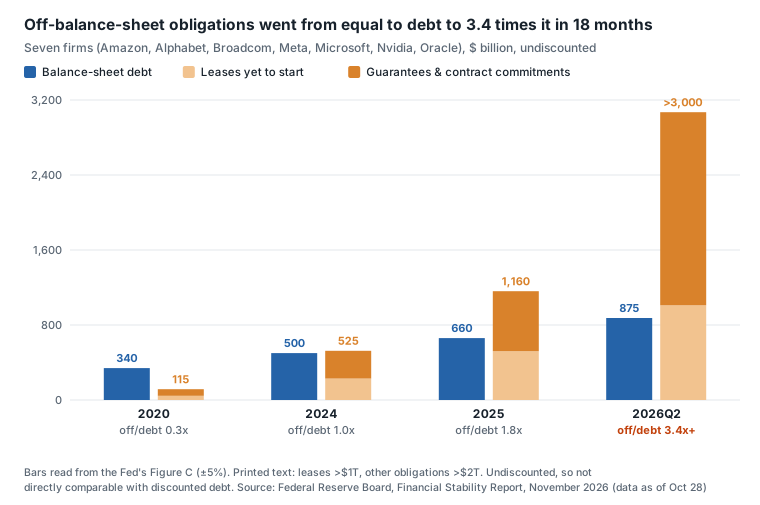
Through 2024, off-balance-sheet obligations were about the size of balance-sheet debt. By mid-2026 they were more than 3.4 times as large. The option to wait for the answer became a commitment in a year and a half. The Fed notes that these amounts are undiscounted and so not directly comparable with debt. The direction and the speed are still clear.
This also changes the answer to Marks’s first check: how many things have to go right? When fixed obligations grow, a small miss in revenue becomes a larger miss in profit. Marks’s test (would you bet that earnings per share in five years land within ±50% of your estimate?) gets harder to pass than balance-sheet debt alone suggests.
A downturn would also look different. Long leases and take-or-pay contracts are hard to cancel. If demand cracks, the first news is more likely to be renegotiation and deferral than cancellation.
$3 trillion is three years of the capital Marks says AI needs
Marks estimates that AI will need about $1 trillion of new capital a year, several hundred billion of it in debt. He gives no source. Read the comparison below as a sense of scale, not a precise calculation.
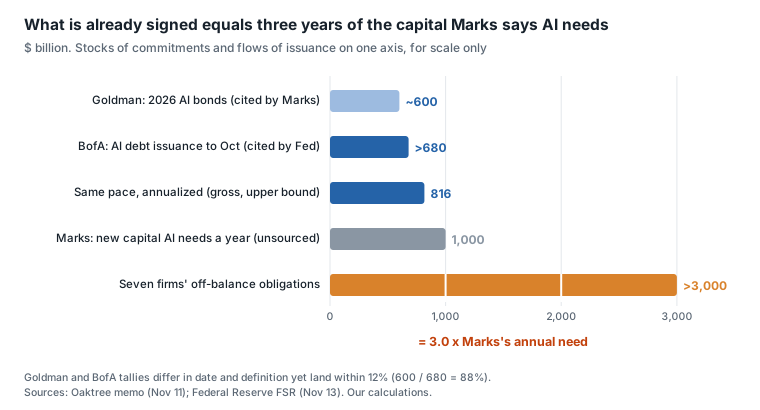
We put Marks’s numbers next to the Fed’s.
| Question | Calculation | Result | How to read it |
|---|---|---|---|
| How big are the commitments? | $3 trillion off-balance-sheet ÷ Marks’s $1 trillion a year | 3.0 years | Multi-year nominal against an annual flow; a sense of scale only |
| How fast is debt growing? | $680 billion ÷ 10 months × 12 months | $816 billion a year | Gross issuance including refinancing, so an upper bound. It sits at the very top of Marks’s “several hundred billion” |
| Is the issuance figure reliable? | Goldman Sachs $600 billion ÷ BofA $680 billion | 88% | Two tallies with different dates and definitions land within 12% of each other |
The last row matters. The Goldman number Marks cites and the BofA number the Fed cites are separate counts. They still come out at almost the same size. The volume of AI corporate debt is a cross-checked fact, not one bank’s claim.
The bond market took the volume and did not move the price
AI-related debt issuance was $130 billion in all of 2023. In 2026 it passed $680 billion by October. AI’s share of nonfinancial investment-grade issuance rose from under 6% to about 31%. Outstanding public AI-related debt is above $1.1 trillion, and private deals are not in that count, so the real total is larger.
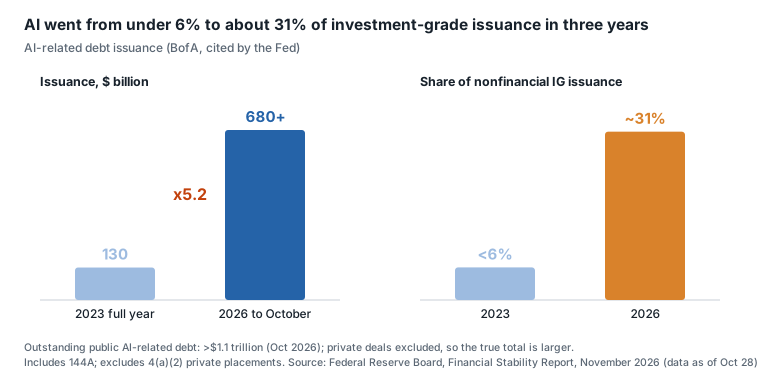
When one industry takes close to a third of investment-grade issuance, it usually pays for it. Lenders ask for a higher rate on concentrated risk. This time the trace is small.
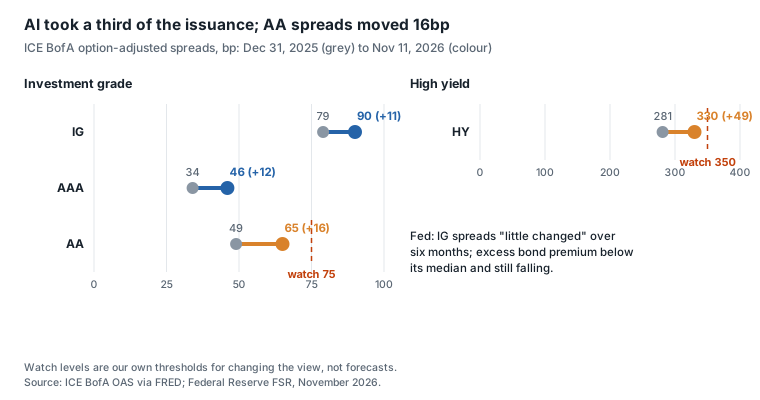
Since the start of the year, investment-grade spreads have widened 11bp. The AA bucket, where hyperscalers cluster, moved a little more, 16bp. The Fed described investment-grade spreads as “little changed” over six months. The excess bond premium, which isolates the reward for credit risk, sat below its median and kept falling. The largest investment-grade data center operators issued more than $150 billion of bonds this year and met “strong investor demand.”
Volume is crowding into one place and the price is not giving way. Lenders are not being paid for concentration risk.
We also share new analyses on Telegram as they are published. You are welcome to join us at @korea_invest_insights.
Stocks took a discount and credit did not
Marks’s fourth check asks how much optimism is already in the price. Stocks and bonds give different answers.
On the equity side, the Fed wrote that concerns about capex and borrowing have “partly offset” valuations. Forward price-to-earnings ratios came down over the year as earnings estimates rose. The market is putting at least some price on the uncertainty.
Credit has no such discount. A corporate bond’s upside is capped at its coupon. If things go well you get the promised interest. If they go badly you lose principal. When spreads on that kind of asset sit near historic lows, the asymmetry works against the lender.
Marks closes with Warren Buffett’s 1979 line: “Uncertainty actually is the friend of the buyer of long-term values.” That holds only when uncertainty carries a price. AI corporate debt carries very little of one today.
The “safe” layers are no exception. Loans on long-leased data centers and hyperscaler bonds are classed as predictable assets. They sit on the same AI factor. Under Marks’s fifth check (does this add to or diversify the risk you already hold?), these layers keep the AI risk and give up the upside.
The least predictable layers are funded by the weakest money
Marks’s memo includes predictability scores by sector. They are Claude’s answers to Marks’s question, not data. Placed next to the Fed’s map of who holds the risk, they are still useful.
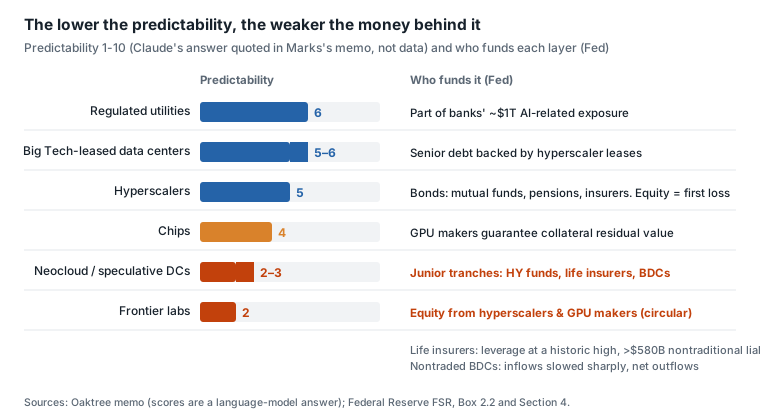
The lower the score, the weaker the balance sheet behind the money. According to the Fed, the subordinated and equity tranches of the special purpose entities that fund data centers are held by high-yield bond funds, life insurers, BDCs (business development companies, a form of private lending fund) and other private debt vehicles.
Those holders are not in good shape. Life insurer leverage is at a historic high, their nontraditional liabilities exceed $580 billion, and about 38% of general account assets are hard to sell. Nontraded perpetual BDCs are relying on redemption limits, inflows have slowed sharply and they are in net outflow. Private credit default rates are at the top of their short history.
Marks’s eleventh question asks which questions your organization is qualified to answer. Laid against this map, the answer is uncomfortable. The investors who bet on the hardest questions have the funding structures least able to wait.
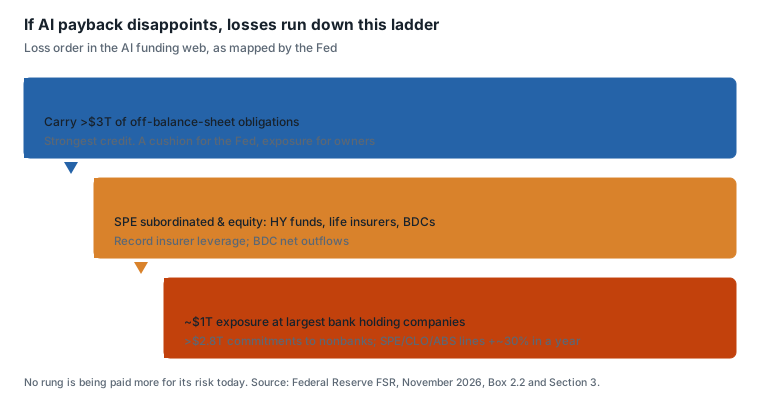
String the loss order together. First come the seven companies’ shareholders. Second come the life insurers, BDCs and high-yield funds holding the junior tranches. Third come the banks that lend to them. The largest bank holding companies have close to $1 trillion of AI-related exposure, and bank commitments to nonbank lenders exceed $2.8 trillion. Commitments to SPEs, CLOs and ABS grew about 30% in a year.
No rung on this ladder is being paid more for its risk today.
Worry went up, and so did leverage
In the New York Fed’s survey of market participants, the share naming AI as a financial stability risk rose from 50% in the spring to 87% in the fall (20 of 23). The positioning data in the same report point the other way.
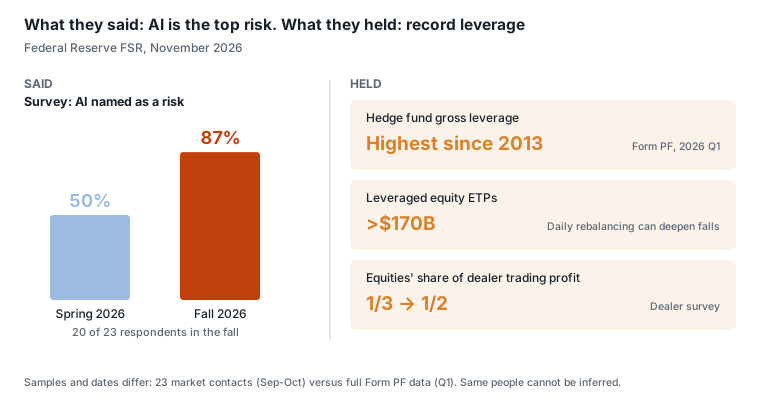
Hedge fund gross leverage is at its highest since data began in 2013. Leveraged equity exchange-traded products hold more than $170 billion, and the Fed noted that their daily rebalancing can deepen falls in single stocks and indexes. Equities’ share of dealer trading profit has gone from a third to a half.
The samples and dates differ. The survey is 23 market contacts in September and October. Hedge fund leverage is a full count for the first quarter of 2026. We cannot say the same people worried and levered up.
The implication is still clear. The fault line Marks describes is one everyone knows about, and the building on top of it has grown taller. The Fed’s first near-term risk is disappointing returns on business investment, and its transmission runs from earnings misses to falling asset values, then tighter credit, then lower capex. In that order, credit comes after stocks. So we read credit spreads as a confirming signal, not a leading one. Equity deleveraging is more likely to give the early warning.
Where the two documents disagree
The two sources see the same structure but do not agree on everything. The gaps are clues for the next call.
| Topic | Marks | Fed | Our reading |
|---|---|---|---|
| Hyperscaler credit ratings | Asks whether ratings could change as cash-rich firms become borrowers | More than 75% of public nonfinancial debt is investment grade, with solid interest coverage | Closer to the Fed for now. Spreads will move before ratings |
| Equity funding capacity | U.S. IPOs raised under $50 billion in 8 of 10 years, so equity cannot fund the build | Listed equity market value up 25.3% in a year | 2026 IPOs reached a record $146 billion by early September (secondary tally), concentrated in a few large AI deals |
| Shareholders as first loss | Asks from the lender’s side | Large firms can absorb losses and cushion the financial system | A cushion for the Fed is exposure for shareholders. The same number changes sign with the reader |
| What each leaves out | Hedge fund leverage, life insurers, bank commitments | Chip life, power and permits, profit capture | Read together, the two leave fewer blanks |
Source incentives matter too. Oaktree is a credit manager, so it weighs the lender’s questions. The Fed looks only at system risk. Neither speaks directly to shareholders’ returns.
The case against us: the commitments were signed on high returns
The strongest counterargument is that these commitments are not reckless. In our model, hyperscalers’ incremental after-tax return on invested capital is 12.2% to 24.7%, above a cost of capital of 9% to 11.5%. The contracts were signed on businesses that make money now. Faith is needed for returns after unit compute prices fall, not for today’s returns.
The 1990s telecom comparison also sides with the counterargument. Reading the Fed’s chart, hyperscalers’ cumulative debt issuance is about 3% to 4% of GDP, half the 7% to 8% telecom reached at the same point. Strong cash flow let them borrow less. The Fed acknowledged the gap and added that it held “at least until this year.”
The counterargument does not change our conclusion. Lease terms run 10 to 20 years, far longer than the period in which today’s high returns have been observed. And it supports shareholders’ expected returns. It does not justify thin bond spreads, because lenders do not share in the upside.
What it means for private and venture investors
This section is a working hypothesis, not part of our published view.
- The 2026 IPO record is concentrated in a few large AI deals. Exit windows for private companies hang on the same single AI factor.
- Net private credit issuance was moderate in 2026 and BDC inflows slowed. The growth rate of corporate private credit in the Fed’s December 11 Z.1 release can serve as an early read on borrowing conditions for growth-stage companies. The last reading was +13.2% over a year.
- If models become commodities, as Marks’s third question suggests, profit flows to users. Application-layer startups are those users. Whether they gain from falling unit prices or lose from shrinking customer budgets will depend on each company’s cost structure.
What we watch next
We set no new dates. We score our two calls (credit is not charging for the risk; the first shock comes through equity leverage) against checkpoints already on the calendar.
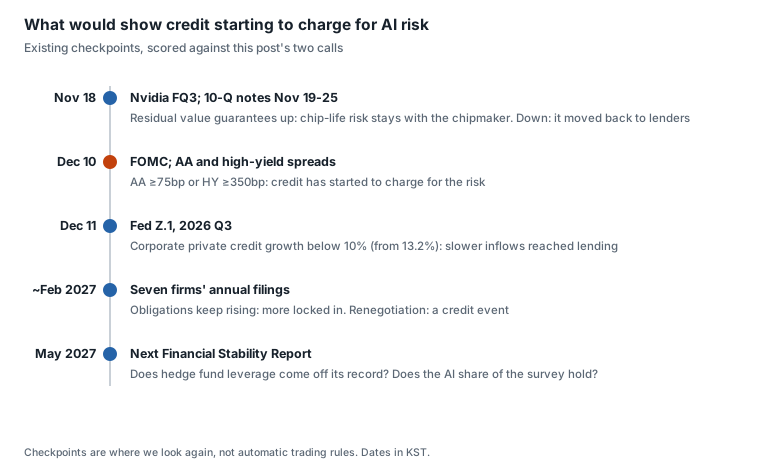
We will revisit the view under these conditions. If the AA spread reaches 75bp or the high-yield spread reaches 350bp, we drop “credit is not charging for the risk.” If any of the seven firms discloses a guarantee payout or a contract renegotiation, we reassess the sharp-downturn scenario. If compute rental prices, frontier lab revenue or 2028 capex guidance turns weak, we read it as the first answer to the “faith” question.
Data notes
- We collected no new external data for this post. Figures come from Marks’s memo, the Fed report and our dated analysis notes comparing them.
- The Fed report’s data cutoff is October 28. Hedge fund data are for the first quarter of 2026, financial accounts for the second quarter, and the survey for September and October.
- Spreads are ICE BofA option-adjusted spreads (FRED) on December 31, 2025 and November 11, 2026. Later moves are not included.
- The seven firms’ debt and yearly off-balance-sheet obligations are read from the Fed’s chart, with about ±5% error. Only the printed “more than $1 trillion” and “more than $2 trillion” are exact.
- The $680 billion is BofA-defined gross issuance, including 144A deals and excluding 4(a)(2) private placements. Refinancing cannot be separated, so treating it as net new funding overstates it.
- Marks’s $1 trillion a year is an unsourced estimate. Calculations that divide by it are for scale only.
- Predictability scores are a language model’s answers, not data.
- The return on capital range is our model estimate.
Sources: Oaktree, A Layman Thinks About AI (2026-11-11) · Federal Reserve Board, Financial Stability Report, November 2026 · FRED, ICE BofA AA US Corporate OAS · FRED, ICE BofA US High Yield OAS
Related: The Marginal AI Dollar Is Now Debt · AI Stocks Started Asking Who Pays
If the AI investment cycle turns, which layer reprices first? Reply with A, B, C or D, and the one number that decides it for you.
A. Hyperscaler stocks. Leverage unwinds first.
B. AI corporate bonds. AA and high-yield spreads widen first.
C. The junior holders. Life insurer and BDC redemptions break first.
D. None. Users pay, and the spending earns its return.
This is for research and information only, not investment advice. Views and conditions are analytical assumptions, not trading instructions or individual portfolio decisions. Figures are dated data, and some are secondary compilations. We used Anthropic’s Claude for analysis and writing. Marks’s memo quotes Claude’s answers, the Fed report names frontier AI models as a cyber risk factor, and Anthropic has been reported as a contract counterparty of, and investee of, some of the seven firms. We did not assess the size of that effect.