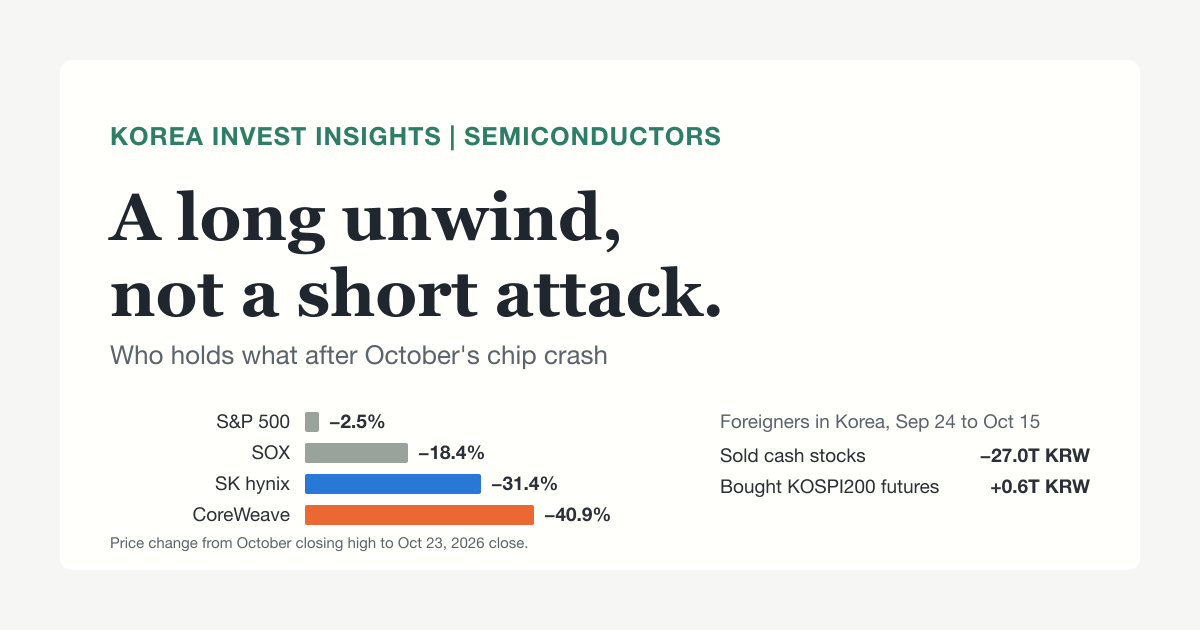
From its October closing high to Friday’s close, the S&P 500 lost 2.5%. Over the same stretch the Philadelphia Semiconductor Index (SOX) fell 18.4%, SK hynix 31.4% and CoreWeave 40.9%. This was not a market-wide panic. One trade came apart: the AI chain.
How it came apart matters more than how far. Hedge funds did not build a big new short against memory or Korea. They sold the longs they already owned, then hedged what they kept with index shorts. In Korea, foreign investors sold KRW 27.0 trillion of cash equities between Sept 24 and Oct 15 while they bought KOSPI 200 futures.
That shape decides what comes next. A book that is long memory and short the index is exposed to correlation more than to direction. The next two weeks, from SK hynix’s results on Oct 28 to Microsoft’s capex wording and the Fed, will show whether it unwinds as a short squeeze or as one more round of forced selling. Here is the map.
Five things to take away
- Only the AI chain fell. The S&P 500 dropped 2.5% while SOX dropped 18.4%. Memory longs and neocloud shorts both fell hard, so many funds lost on both sides at once.
- AI-specific news lit the fire and hedge-fund long sales spread it. Goldman Sachs prime brokerage data showed AI long sales running at 3.5 times short sales in the week to Oct 14.
- The book left behind is a hedged crowd: long whoever gets paid by AI, short the index and the debt-funded builders. Its weak point is correlation. If longs fall while shorts rise, the loss is about 3.3 times larger than when both fall together.
- Korea fell on foreign selling of cash equities, not on index shorts. A lasting rebound needs foreigners to buy Samsung Electronics and SK hynix shares again, not just to cover futures.
- Our base case (50%, subjective) is a short cover once the event cluster passes. One more leg down has a combined 35%.
Prices are Oct 23 closes. Korean closes are the final prints after the extended session ends at 20:00 KST. Probabilities are our subjective estimates as of Oct 23. This is analysis, not a trading instruction.
Only the AI chain fell, and both sides of the book fell with it
The first question is simple: did the market fall, or did one trade fall? Blue bars are names hedge funds typically hold long. Orange bars are what they use as hedges or short.
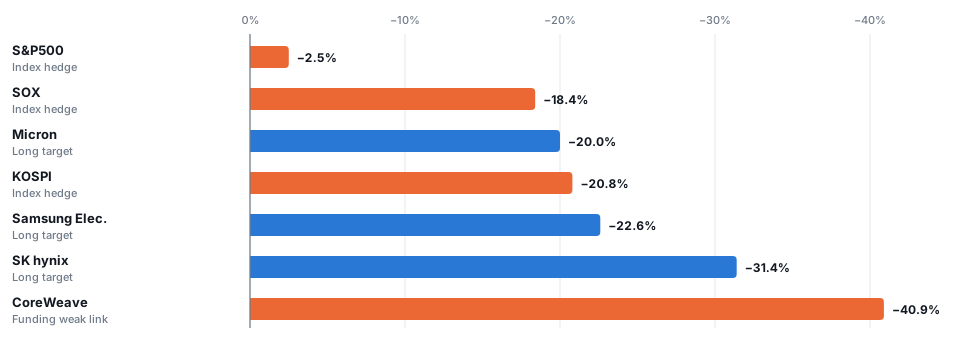
The broad index barely moved while every AI-linked name fell by a fifth or more. The memory longs and the neocloud shorts went down together, which is the painful case for a long/short book. Over the same weeks DRAM spot prices rose. The closes behind the chart are below.1
| Name | Role in the book | October closing high | Oct 23 close | Change |
|---|---|---|---|---|
| S&P 500 | Index hedge | Oct 6: 7,818.93 | 7,623.68 | −2.5% |
| SOX | Index hedge | Oct 6: 13,217.82 | 10,779.46 | −18.4% |
| Micron | Long | Oct 1: $1,097.39 | $877.55 | −20.0% |
| KOSPI | Index hedge | Oct 2: 7,003.74 | 5,550.30 | −20.8% |
| Samsung Electronics | Long | Oct 2: KRW 276,000 | KRW 213,500 | −22.6% |
| SK hynix | Long | Oct 2: KRW 1,842,000 | KRW 1,263,000 | −31.4% |
| CoreWeave | Debt-funded short | Oct 6: $91.72 | $54.24 | −40.9% |
AI news lit the fire; hedge-fund long sales spread it
The next question is cause. The chain below runs from the trigger to the buyers who absorbed the supply.
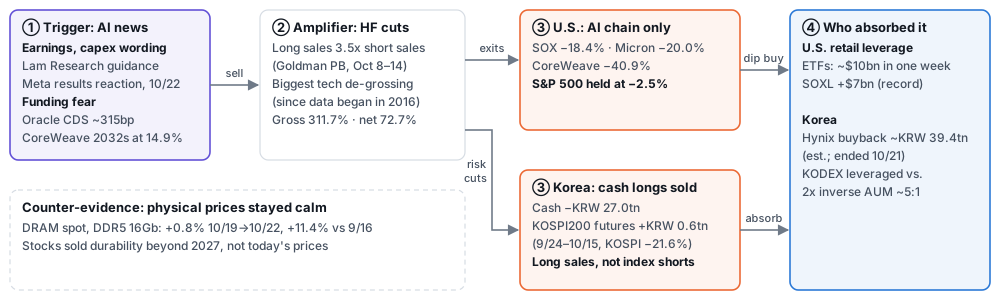
The trigger was news specific to AI. Lam Research and Meta reported on Oct 21 U.S. time, and the Oct 22 drop followed. Lam guided the December quarter to $8.6 billion, plus or minus $0.4 billion, slightly above consensus, yet the stock fell about 7% after hours.2 We read that guidance as a supply ceiling, not weaker demand. Meta raised the low end of its 2026 capital spending range to $135 billion to $145 billion, kept the top and gave no 2027 number.3 Credit added a funding scare: Oracle’s five-year CDS was near 315bp and CoreWeave’s 2032 notes yielded about 14.9% on Oct 19.4
Hedge funds turned that news into a rout. In Goldman Sachs prime brokerage data, AI long sales ran at 3.5 times short sales over Oct 8 to 14.5 Tech de-grossing in the five sessions to Oct 15 was the largest since the data began in 2016.6 In the week of Oct 16, gross leverage stood at 311.7% and net leverage at 72.7%.7 Funds kept their gross exposure and cut their net.
Two groups took the other side. U.S. retail investors put about $10 billion into leveraged ETFs in one week, including a record $7 billion into SOXL.8 In Korea, SK hynix’s KRW 40 trillion buyback absorbed supply until it ended on Oct 21. By our estimate from investor-flow data it had bought about KRW 39.4 trillion.9 Assets in Korea’s KODEX leveraged ETF were about five times those in the 2x inverse fund.10
The physical market did not confirm the panic. DDR5 16Gb spot averaged $61.10 on Oct 22, up 0.8% from Oct 19 and 11.4% from Sept 16.11 The stocks sold the durability of memory profits beyond 2027, not today’s prices.
Much of the mechanical selling is already done. Goldman’s model of CTA global equity longs fell from about $125 billion to $39 billion, down 69%.12 In the BofA fund manager survey, the share calling semiconductors the most crowded trade fell from 82% to 45%.13 The fuel left for another drop sits mostly with leveraged retail.
The book is a hedged crowd: long who gets paid, short who borrows
What do the funds hold now? The map below shows the book behind the selloff.
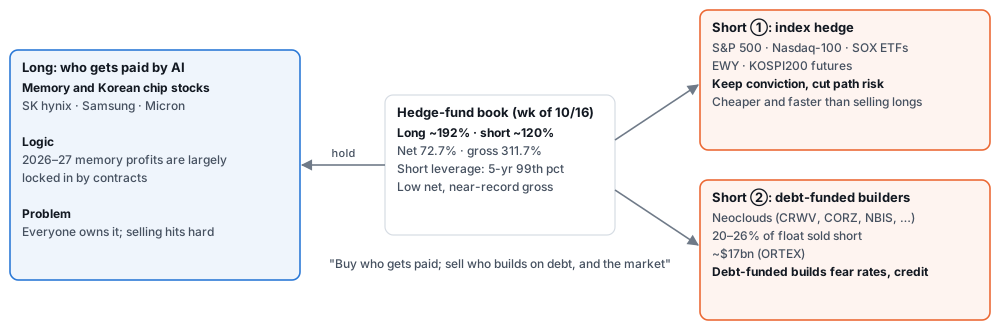
The logic has three parts.
- Why own memory. A large share of 2026 and 2027 memory profits is already set by long-term contracts. The more AI spends, the more these companies get paid.
- Why short the index instead of selling memory. Everyone owns the same longs, so selling them moves prices against you. Index and ETF shorts are cheaper and faster, and they fit multi-manager risk limits. Goldman’s short leverage was at the 99th percentile of the past five years.14
- Why short the neoclouds. Companies that build data centers with debt and leases are hurt first when rates and credit wobble. Short interest in five neoclouds reached about $17 billion, or 20% to 26% of their float.15
The weak point of this book is correlation, not direction. The chart below uses a simplified book of 193% long and 120% short of equity, close to the reported gross and net.
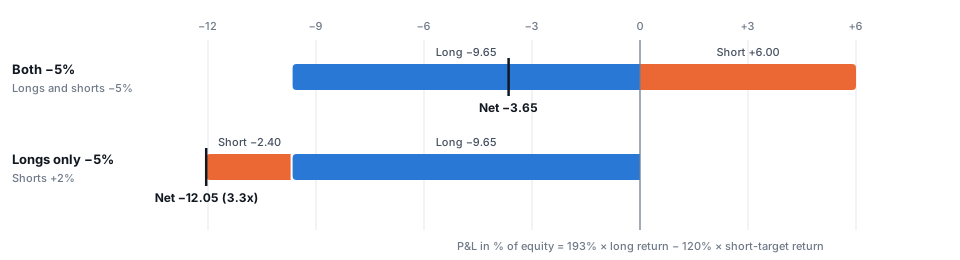
If longs and short targets both fall 5%, the book loses 193% × 5% − 120% × 5% = 3.65 points of equity. If longs fall 5% while short targets rise 2%, it loses 9.65 + 2.40 = 12.05 points, 3.3 times more. That is when risk managers force de-grossing. So good news tends to produce a violent short-covering rally, and bad news on the long side produces the opposite: crowded longs down, shorted names up.
Korea fell on foreign cash selling, not index shorts
Korea is the clearest test of the long-unwind reading. Blue bars are foreign net buying of KOSPI cash equities. Orange bars are foreign net buying of KOSPI 200 futures.
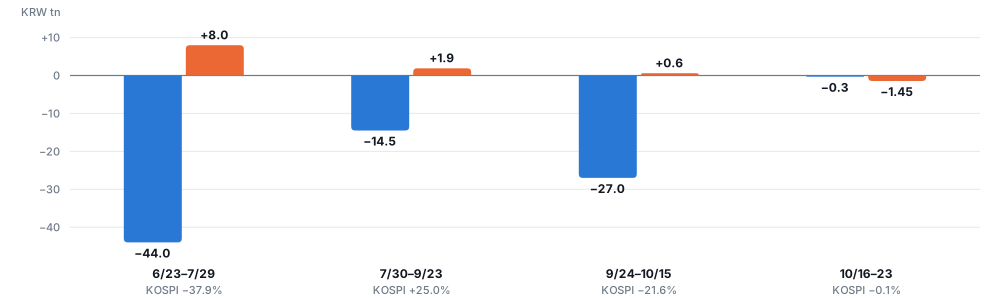
In every sharp decline, foreigners sold cash equities in size and bought futures. Index shorts did not build up. The table gives the windows; futures figures are estimates.16
| Window | KOSPI | Foreign cash (KRW tn) | KOSPI 200 futures (KRW tn) |
|---|---|---|---|
| Jun 23 to Jul 29 | −37.9% | −44.0 | +8.0 |
| Jul 30 to Sep 23 | +25.0% | −14.5 | +1.9 |
| Sep 24 to Oct 15 | −21.6% | −27.0 | +0.6 |
| Oct 12 to 15 (part of the above) | −16.2% | −11.5 | +3.2 |
| Oct 16 to 23 | −0.1% | −0.3 | −1.45 |
Short positions point the same way. The short balance in Samsung Electronics fell from 0.12% to 0.07% of shares, and short interest in the iShares MSCI South Korea ETF (EWY) fell 64% from mid-July to the end of September.17
Since Oct 16 the pattern has changed. Foreign cash selling has nearly stopped, and futures are sold on up days. That looks like keeping the longs and hedging the index. We sort each Korean session into one of four boxes.
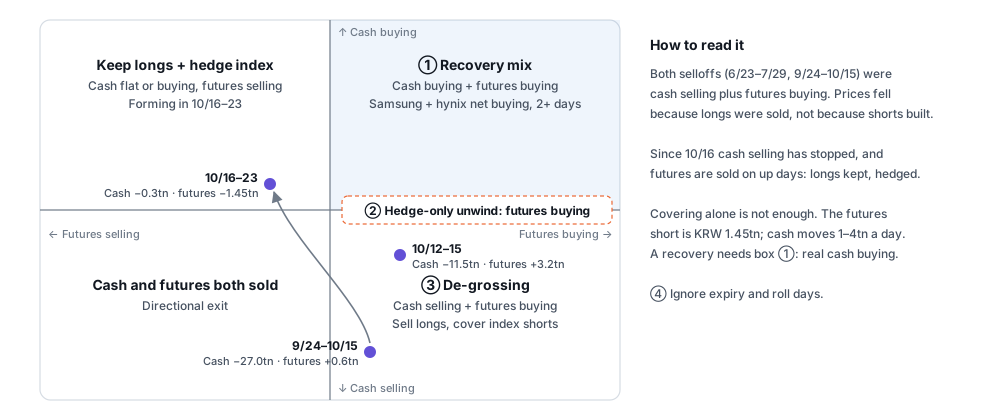
The chart has no scale; the dots show direction only. Futures covering alone will not turn Korea. The futures short built since Oct 16 is about KRW 1.45 trillion, while cash flows move KRW 1 to 4 trillion on a typical day. A recovery needs box ①: foreign net buying of Samsung Electronics and SK hynix for at least two sessions, together with futures buying. Expiry and roll days do not count.
The next two weeks decide it: squeeze or one more leg down
A cluster of events lands between Oct 27 and Nov 3. Times are Korea time (KST); U.S. events after the close arrive the next morning in Korea.18
| KST | Event | What it tests |
|---|---|---|
| Oct 27, morning | FINRA short interest (released Oct 26 U.S.) | Did neocloud shorts hold or grow? That is squeeze fuel |
| Oct 28 | SK hynix third-quarter results | Memory contract visibility into 2027 |
| Oct 29, 00:55 | Oracle investor day | Funding plans for debt-built capacity |
| Oct 29, 03:00 | FOMC decision | Rates for the borrowers |
| Oct 29, early morning | Alphabet and Microsoft results | Capex and demand wording |
| Oct 29 | Samsung Electronics results call | Memory pricing and HBM |
| Oct 30, early morning | Amazon and Sandisk results | Capex and memory cost absorption |
| Nov 3 | U.S. midterm elections | Policy risk |
We weigh four paths to about Nov 6.
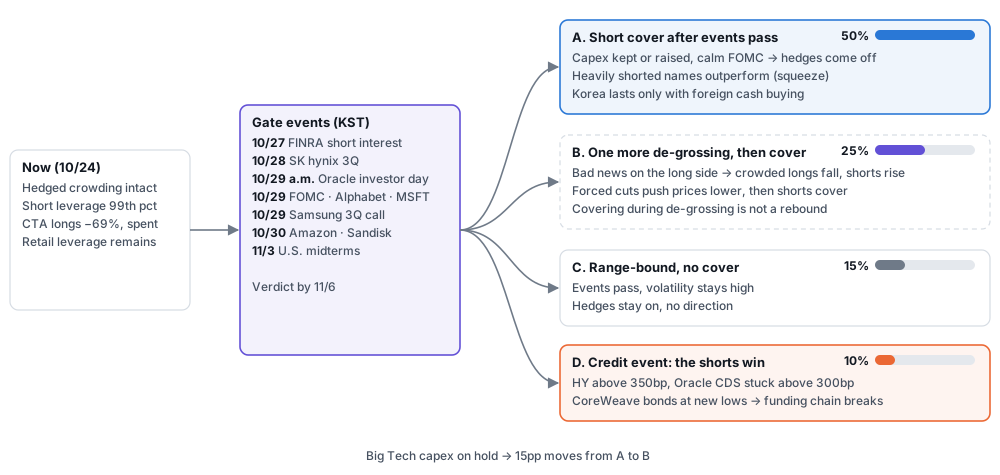
- A. Short cover after the events pass (50%). Capex is kept or raised and the FOMC is uneventful. Funds lift hedges and the most shorted names outperform. In Korea the rally lasts only if foreign cash buying returns.
- B. One more round of de-grossing, then a cover (25%). Bad news on the long side pushes crowded longs down while shorted names rise. Forced cuts take prices lower first. Covering during de-grossing is not a rebound.
- C. Range-bound without a cover (15%). The events pass, volatility stays high, hedges stay on and the market has no direction.
- D. A credit event that proves the shorts right (10%). High-yield spreads above 350bp, Oracle CDS stuck above 300bp and CoreWeave bonds at new lows would mean the funding chain is breaking.
If Big Tech puts 2027 capex on hold, we move 15 points from A to B. Together, the two downside paths (B and D) carry 35%.
Signals that tilt toward a squeeze
- Microsoft’s wording passes at least three of four tests: demand still exceeds supply; calendar 2026 capex is raised or the December-quarter capex is at least the September quarter’s; leases not yet commenced keep growing; Azure grows 45% or more. We put the odds near 42%.
- Alphabet and Amazon keep or raise capex and absorb higher memory prices without cutting build plans.
- FINRA data show neocloud shorts held or grew as of Oct 15. That is the fuel.
- Floors hold: the S&P 500 above 7,508 (Goldman’s medium-term CTA level), high-yield spreads below 350bp, CoreWeave’s 2032 notes above 75 cents.12
- In Korea, foreigners buy Samsung Electronics and SK hynix shares for two or more sessions while also turning buyers of futures.
- Oracle’s five-year CDS stays below 300bp for five sessions.
Signals that tilt toward another drop
- Big Tech puts 2027 capex on hold or cuts it.
- Credit: high-yield spreads above 350bp, Oracle CDS above 300bp for days, CoreWeave bonds at new lows.
- Trend followers: an S&P 500 close below 7,508 risks flipping CTAs short. Goldman estimated about $143.8 billion of selling in a one-month decline.12
- Retail leverage unwinds: large redemptions from SOXL or Korea’s KODEX leveraged ETF.
- In Korea, foreign cash selling resumes (KRW 1 trillion or more in a day, or KRW 3 trillion or more over five sessions) together with futures buying.
Where a squeeze would bite hardest
Ranked by squeeze sensitivity, the names are CoreWeave (CRWV), Core Scientific (CORZ), Nebius (NBIS), Galaxy Digital (GLXY), Hut 8 (HUT) and Teradyne (TER). We leave out IREN, TeraWulf (WULF), Fluence (FLNC) and Bloom Energy (BE): heavy convertible-bond hedging means hedge selling appears as they rise. IREN and Nebius are more sensitive to Microsoft’s wording than CoreWeave. This is a ranking of sensitivity, not a recommendation.
History leans against fresh shorts after big drops. From January 2025 to October 2026, a day when SOX fell 3% or more was followed by an average 20-day gain of 5.1%, with gains 64% of the time. A day when SK hynix fell 5% or more was followed by an average 20-day gain of 9.0%. The exception is Korea’s rallies: after a KOSPI gain of 3% or more, the next 20 days averaged 0.0% with gains only 42% of the time, and the median low within 10 days was 5.1% below. Rallies without foreign cash buying were sold.19 That sample is a bull market, so treat it as a base rate, not a forecast.
Your turn
Which path do you think we are on, A, B, C or D? And which single signal would change your mind? Tell me in the comments. Push back where you think the map is wrong.
If this map helped you, a like helps other investors find it.
Disclaimer: For research and information purposes only. Not investment advice. Names cited are for analytical illustration; readers should perform their own due diligence and consult licensed advisors before any investment decision.
Daily closes retrieved Oct 24, 2026: S&P 500 from Yahoo Finance; SOX, Micron and CoreWeave from Nasdaq; KOSPI, Samsung Electronics and SK hynix from Naver Finance (KRX final closes after the extended session). Earlier figures that used provisional Korean closes were replaced. ↩︎
Lam Research, results for the quarter ended September 27, 2026 (SEC Form 8-K, Exhibit 99.1), 2026-10-21. The supply-ceiling reading is our interpretation. ↩︎
Meta Platforms, third-quarter 2026 results (SEC Form 8-K, Exhibit 99.1), 2026-10-21. ↩︎
CNBC, report on CoreWeave and Oracle credit stress, 2026-10-19. Oracle five-year CDS at 315bp and CoreWeave’s 9.625% 2032 notes at about 14.9% yield as reported; other sources quoted Oracle CDS near 322bp a day later. The 75-cent line is our own threshold. ↩︎
Goldman Sachs Prime Brokerage data on AI-stock flows for Oct 8 to 14, as shared by The Daily Shot on 2026-10-16. Secondary; no public link to the original note. ↩︎
Bloomberg via Yahoo Finance, hedge funds dumped tech stocks, 2026-10-19. Goldman Sachs prime brokerage data. ↩︎
Tickmill, summary of Goldman Sachs notes on the tech liquidation and the retail ETF chase, 2026-10-20. Gross 311.7% and net 72.7% for the week of Oct 16. Secondary summary of a paid note. ↩︎
Same Tickmill summary of Goldman Sachs notes, 2026-10-20: about $10 billion into leveraged ETFs in one week and a record $7 billion into SOXL. Secondary. ↩︎
SK hynix newsroom, share buyback and retirement, program of KRW 40 trillion approved 2026-08-19; completion reported by Chosun Biz on 2026-10-21. The KRW 39.4 trillion executed is our estimate from “other corporations” net buying in KRX investor data, not a disclosed figure. ↩︎
Naver Finance ETF data as of 2026-10-23: KODEX Leverage at about KRW 4.41 trillion in market value against about KRW 0.86 trillion for KODEX 200 Futures Inverse 2X. ↩︎
TrendForce, DRAM spot price, DDR5 16Gb session average $61.10 on 2026-10-22 against $54.83 on 2026-09-16, from a captured price table. ↩︎
Tickmill summaries of Goldman Sachs flow notes: Oct 13 (about $143.8 billion of CTA selling in a one-month decline), Oct 15 and Oct 20 (CTA global equity longs from about $125 billion to $39 billion; medium-term S&P 500 level 7,508). Secondary summaries of paid notes. ↩︎ ↩︎ ↩︎
Mace News, BofA Global Fund Manager Survey for October, 2026-10-13. Secondary summary. ↩︎
Bloomberg, hedge funds pile into shorts as Goldman flags stock squeeze risk, 2026-10-22. The 193% long and 120% short split in our chart is a rounded reading of shared prime brokerage charts, consistent with the gross and net figures above, and is used for illustration. ↩︎
Reuters, short sellers pocket $6 billion in profits as neoclouds slide on AI debt fears, 2026-10-22, citing ORTEX data for CoreWeave, IREN, Nebius, Applied Digital and Core Scientific. ↩︎
Naver Finance investor-trend data (KRX based). Foreign cash flows by window are our sums of daily data; the Oct 16 to 23 total of about KRW −0.31 trillion was rechecked on Oct 24. KOSPI 200 futures amounts are estimates scaled against broker data and are used for direction. ↩︎
Samsung Electronics short balance from AlphaSquare (6.77 million shares on Sep 17 to 4.17 million on Oct 21; secondary). EWY short interest from FINRA consolidated short interest: 36.97 million shares on Jul 15 to 13.32 million on Sep 30. October data were not yet published. ↩︎
FINRA short interest schedule; SK hynix earnings call notice; Oracle investor day notice; Federal Reserve FOMC calendar; Microsoft earnings date; Alphabet earnings date; Amazon earnings webcast; Sandisk results date; Samsung Electronics IR events. ↩︎
Our calculation from daily closes, January 2025 to October 2026. The sample is mostly a rising market. ↩︎