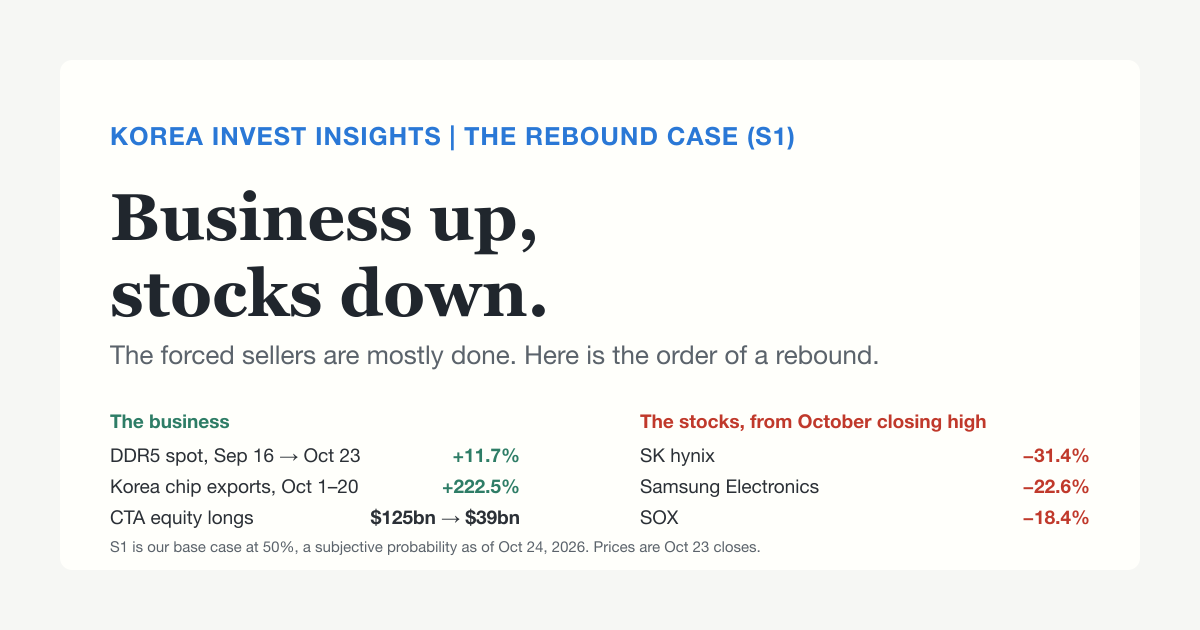
Our base case for the chip selloff is S1: a rebound under a hawkish Fed hold, at 50% (subjective, Oct 24). This post reads the market as if S1 is the path. It asks two questions. What does today look like through that lens? And if S1 plays out, in what order should things happen?
The short version: the business went up while the stocks went down. DDR5 spot prices rose 11.7% from Sep 16 to Oct 23, and Korea’s chip exports for Oct 1–20 were up 222.5% from a year earlier. Over the same weeks SK hynix fell 31.4% from its October closing high.12 A gap that wide is what forced selling looks like, and the forced sellers are mostly done.
S1 is not a promise of a straight line up. It is a rebound with a shakeout first and a ceiling from rates. A companion post reads the same market through the credit-squeeze case (S2).
Five things to take away
- Under S1 the October drop was a crowded long book being forced out, not a demand break. The earnings layer for 2026–27 got stronger while the stocks fell.
- Most of the mechanical selling is done. Goldman’s model of CTA equity longs fell from about $125 billion to $39 billion, and foreign cash selling in Korea fell from KRW 27.0 trillion over Sep 24–Oct 15 to KRW 0.31 trillion over Oct 16–23.34
- S1 needs four things this week: SK hynix confirms 2027 contracts and a new buyback, Microsoft passes three of our four tests, Big Tech keeps capex up, and the Fed holds without hike language.
- Expect the rebound in a specific order: the most-shorted neoclouds cover first, memory rises later on long re-buying, and in Korea foreign buying shows up in Samsung Electronics before SK hynix.
- Rates set the ceiling. Futures put only about an 8% chance on an October hike but high odds on December, so S1 is a rebound with a lid.5
Prices are Oct 23 closes; Korean closes are final prints after the 20:00 KST extended session. Probabilities are our subjective estimates.
How today reads under S1
The business went up while the stocks went down
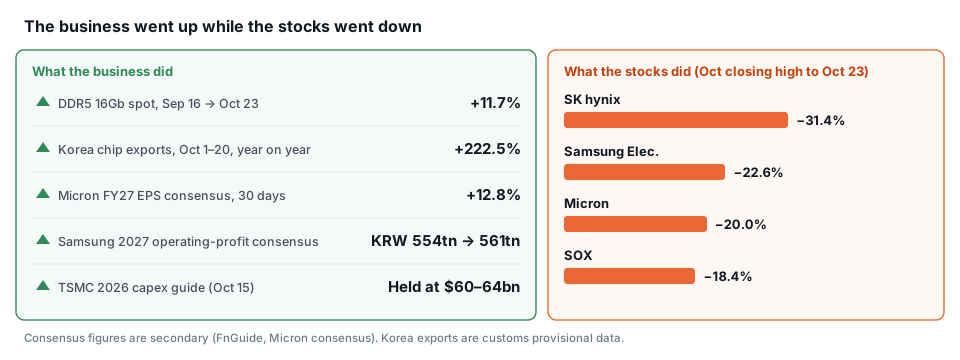
Every line on the left moved the right way in October. DDR5 16Gb spot averaged $61.27 on Oct 23, up from $54.83 on Sep 16.1 Korea’s chip exports for the first 20 days of October reached $27.5 billion.2 Consensus for Samsung’s 2027 operating profit rose to KRW 561 trillion at FnGuide, and Micron’s FY27 EPS consensus rose 12.8% in 30 days.6 TSMC kept its 2026 capex guide at $60–64 billion on Oct 15.7
Demand behind those numbers is still booked ahead. Amazon said in July that its 2027 capacity is largely reserved and that a good part of 2028 is reserved too.8 Samsung said five customers had signed long-term agreements, though its 60–70% allocation plan also counts deals not yet signed.9
Under S1, the market sold the durability of memory profits beyond 2027 and the cost of AI capital, not today’s demand. The 2026–27 layer is barely priced; the 2028 layer is heavily priced.
The forced sellers are mostly done
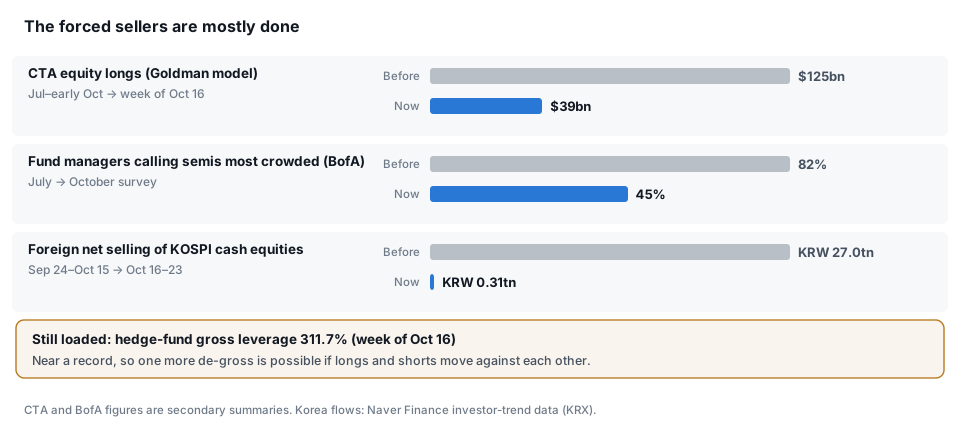
Three groups did most of the selling, and each has largely stopped.
- Trend followers. Goldman’s model of CTA equity longs fell about 69% to roughly $39 billion in the week of Oct 16.3
- Crowded fund managers. In BofA’s survey, the share calling semiconductors the most crowded trade fell from 82% in July to 45% in October.10
- Foreign investors in Korea. They sold KRW 27.0 trillion of KOSPI cash equities from Sep 24 to Oct 15, then only KRW 0.31 trillion from Oct 16 to Oct 23. Samsung Electronics even saw foreign net buying of about 4.55 million shares in that second window.4
The Oct 22 drop also looked like positioning, not credit. SOX fell 6.7% that day, yet the equal-weight S&P 500 rose 0.7%, an investment-grade bond ETF rose 1.1% and the 10-year Treasury yield fell 17bp.11 A credit event usually drags those down together.
There is one loaded spring left. Hedge funds still run gross leverage of about 312%, near a record.12 If longs fall while shorts rise, they could be forced to cut once more. That is why S1 comes with a shakeout risk.
The stress sits at the weak end, not with memory buyers
S1 does not say credit is fine. It says the stress is concentrated. Investment-grade spreads are 89bp, still below our 100bp bear line, while the pressure sits with Oracle and the debt-funded neoclouds.13 Those borrowers matter for 2028 orders, not for the 2026–27 profits already under contract. The companion S2 post looks at what happens if that changes.
What S1 needs this week
- Oct 28, SK hynix. Two things: a clear share of 2027 HBM4 volume under contract, and a new shareholder-return plan. Brokers expect funding of more than KRW 30 trillion.14 Company buybacks did much of the buying under the July rebound, and the last program ended on Oct 21; a new one would restore that bottom buyer.
- Oct 29, Microsoft. Three of four tests: demand still exceeds supply; calendar 2026 capex is raised or the December quarter is at least the September quarter; leases signed but not yet started keep growing; Azure grows 45% or more. We put the odds near 42%.
- Oct 29–30, Alphabet and Amazon. Capex held or raised, and memory price increases absorbed without cutting build plans.
- Oct 29, FOMC. A hold without language that points to more hikes. Markets price only about an 8% chance of an October hike.5
- Oct 30–Nov 7, the bond window. US high-yield spreads at 330bp or less with deals clearing. They were 340bp on Oct 22.13
How S1 would unfold
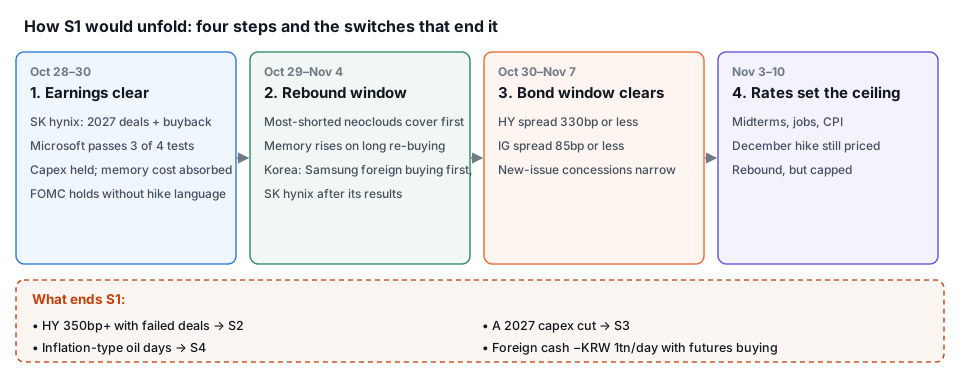
Step 1, Oct 28–30: earnings clear. The first day that splits the paths is Oct 29. If the tests above pass, hedges start to come off.
Step 2, Oct 29–Nov 4: the rebound window. The order matters. Short covering hits the most-shorted names first; neocloud shorts were about 20–26% of float.15 Memory stocks are not heavily shorted, so they rise later and more slowly, on long re-buying. In Korea we expect foreign buying to show up in Samsung Electronics first and in SK hynix after its results. The fingerprint to look for is retail selling while foreigners buy. On Jul 31, the day after the July low, foreigners bought KRW 7.24 trillion of KOSPI stocks while individuals sold KRW 8.28 trillion.16
Step 3, Oct 30–Nov 7: the bond window clears. Hyperscalers and their partners usually issue bonds after earnings. S1 needs those deals to clear without bigger concessions, with high-yield spreads back at 330bp or less and investment-grade at 85bp or less.
Step 4, Nov 3–10: rates set the ceiling. The midterms, October jobs (Nov 6) and October CPI (Nov 10) decide how far the rebound runs. With a December hike still priced, a 10-year yield near 5% caps valuations.
What the base rates say
History supports a rebound but warns about the path. Since 1994, after a day when SOX fell 6% or more (97 cases), the index was higher ten days later 63% of the time. In the 33 cases that looked like a crowding unwind, it was higher 64% of the time, but 58% saw another 5% drop first.17 Hedge funds’ AI net flows also sit at levels last seen near the April and July lows; SOX rose 38.7% and 13.7% over the next 21 sessions in those two cases, though two cases prove little.18
Korea needs a caveat. In 2025–26, after a KOSPI gain of 3% or more, the next 20 sessions averaged 0.0% and rose only 42% of the time. Rallies without foreign cash buying faded.17
So the S1 expectation is a rebound, likely after one more shakeout, led by the most-shorted names and capped by rates.
What ends S1
- High-yield spreads at 350bp or more with failed deals. S1 turns into S2.
- One Big Tech company cuts 2027 capex. That moves toward S3, the demand slowdown.
- Inflation-type oil days. Brent above $110 while inflation gauges rise keeps the macro-shock case (S4) at 20% or higher.
- Korea’s flow turns. Foreign cash selling of KRW 1 trillion or more in a day, or KRW 3 trillion over five sessions, together with futures buying.
- The earnings layer cracks. An annual cut to next year’s memory consensus. Quarterly estimates for Samsung’s first two quarters of 2027 have already slipped about 2.6–2.7%, so this is worth watching.6
Our read
S1 is our base case because the layer that pays memory makers got stronger while the price fell, and the sellers who drove October look mostly spent. The weak spot in this reading is credit: the S1 gate of 330bp on high-yield spreads is not met today. If the bond window clears, the rebound case gets much stronger. If it fails, read the S2 post next.
Your turn
Do you buy the forced-selling story, or is the market seeing a demand break we are missing? Which S1 test do you think fails first: SK hynix’s buyback, Microsoft’s wording, or the bond window? Tell me in the comments. I will score this on Nov 6.
If this helped you think through the week, a like helps other investors find it.
Disclaimer: For research and information purposes only. Not investment advice. Names cited are for analytical illustration; readers should perform their own due diligence and consult licensed advisors before any investment decision.
TrendForce, DRAM spot price: DDR5 16Gb (2Gx8) 4800/5600 session average $61.267 on 2026-10-23 and $54.83 on 2026-09-16, from captured price tables. ↩︎ ↩︎
Korea Customs Service via Korea.kr, exports for Oct 1–20, 2026: semiconductors $27.516 billion, up 222.5% from a year earlier. Provisional data. ↩︎ ↩︎
Tickmill, summary of Goldman Sachs notes, 2026-10-20: CTA global equity longs from about $125 billion to $39 billion. Secondary summary of a paid note. ↩︎ ↩︎
Naver Finance investor-trend data (KRX based). Window totals are our sums of daily data; Samsung Electronics foreign net buying in shares from the same source. Rechecked on Oct 24. ↩︎ ↩︎
FXStreet, 2026-10-23, citing the CME FedWatch Tool: about an 8% chance of an October hike. December hike odds near 83% are from our market tracker as of Oct 23 (secondary). ↩︎ ↩︎
Consensus data compiled by FnGuide (Samsung 2027 operating profit KRW 554 trillion to 561 trillion as of Oct 14; 1Q27 −2.71% and 2Q27 −2.56% quarterly revisions as of Oct 5), with Kiwoom Securities at KRW 555 trillion; Micron FY27 EPS revision over 30 days. Secondary data. ↩︎ ↩︎
TSMC third-quarter 2026 earnings call, 2026-10-15: 2026 capital budget kept at $60–64 billion. ↩︎
Amazon second-quarter 2026 earnings call, 2026-07-30. ↩︎
Samsung Electronics second-quarter 2026 earnings call, 2026-07-30. The 60–70% allocation plan includes agreements not yet signed. ↩︎
Mace News, BofA Global Fund Manager Survey for October, 2026-10-13. Secondary summary. ↩︎
Index and ETF closes for 2026-10-22 from Yahoo Finance, as summarized by StockTitan; 10-year Treasury yield from FRED DGS10, 5.13% on Oct 21 and 4.96% on Oct 22. ↩︎
Same Tickmill summary, 2026-10-20: gross leverage 311.7% and net 72.7% for the week of Oct 16. Secondary. ↩︎
Federal Reserve Bank of St. Louis: ICE BofA US High Yield OAS 3.40% and US Corporate (IG) OAS 0.89% on 2026-10-22, the latest available on Oct 24. ↩︎ ↩︎
Money Today, 2026-10-19, citing securities-industry expectations. The earlier KRW 40 trillion program is in the SK hynix newsroom. ↩︎
Reuters, short sellers and neoclouds, 2026-10-22, citing ORTEX data. ↩︎
Naver Finance investor-trend data for 2026-07-31: foreigners +KRW 7,241.0 billion, individuals −KRW 8,284.0 billion in KOSPI. ↩︎
Our calculation from daily closes: SOX (Yahoo Finance, 1994 onward) and KOSPI (2025–2026). The crowding subset is our classification. Past patterns are base rates, not forecasts. ↩︎ ↩︎
Goldman Sachs prime brokerage AI net-flow chart as shared in market commentary (read from the chart; estimate). Two cases only. ↩︎