Context This is a follow-up to Samsung Electronics vs SK Hynix forward P/E inversion, the AI infrastructure multiple map, and Samsung’s stock-bonus / memory supercycle note. Those notes focused on Samsung Electronics’ HBM and memory rerating. This one asks whether Samsung C&T can work as a lagging proxy after Samsung Electronics’ sharp move. Related hubs: AI HBM Hub and Korean Stocks for Foreign Investors.
TL;DR
The idea of using Samsung C&T as a lagging Samsung Electronics proxy is valid, but it is not a simple “free Samsung stake” trade.
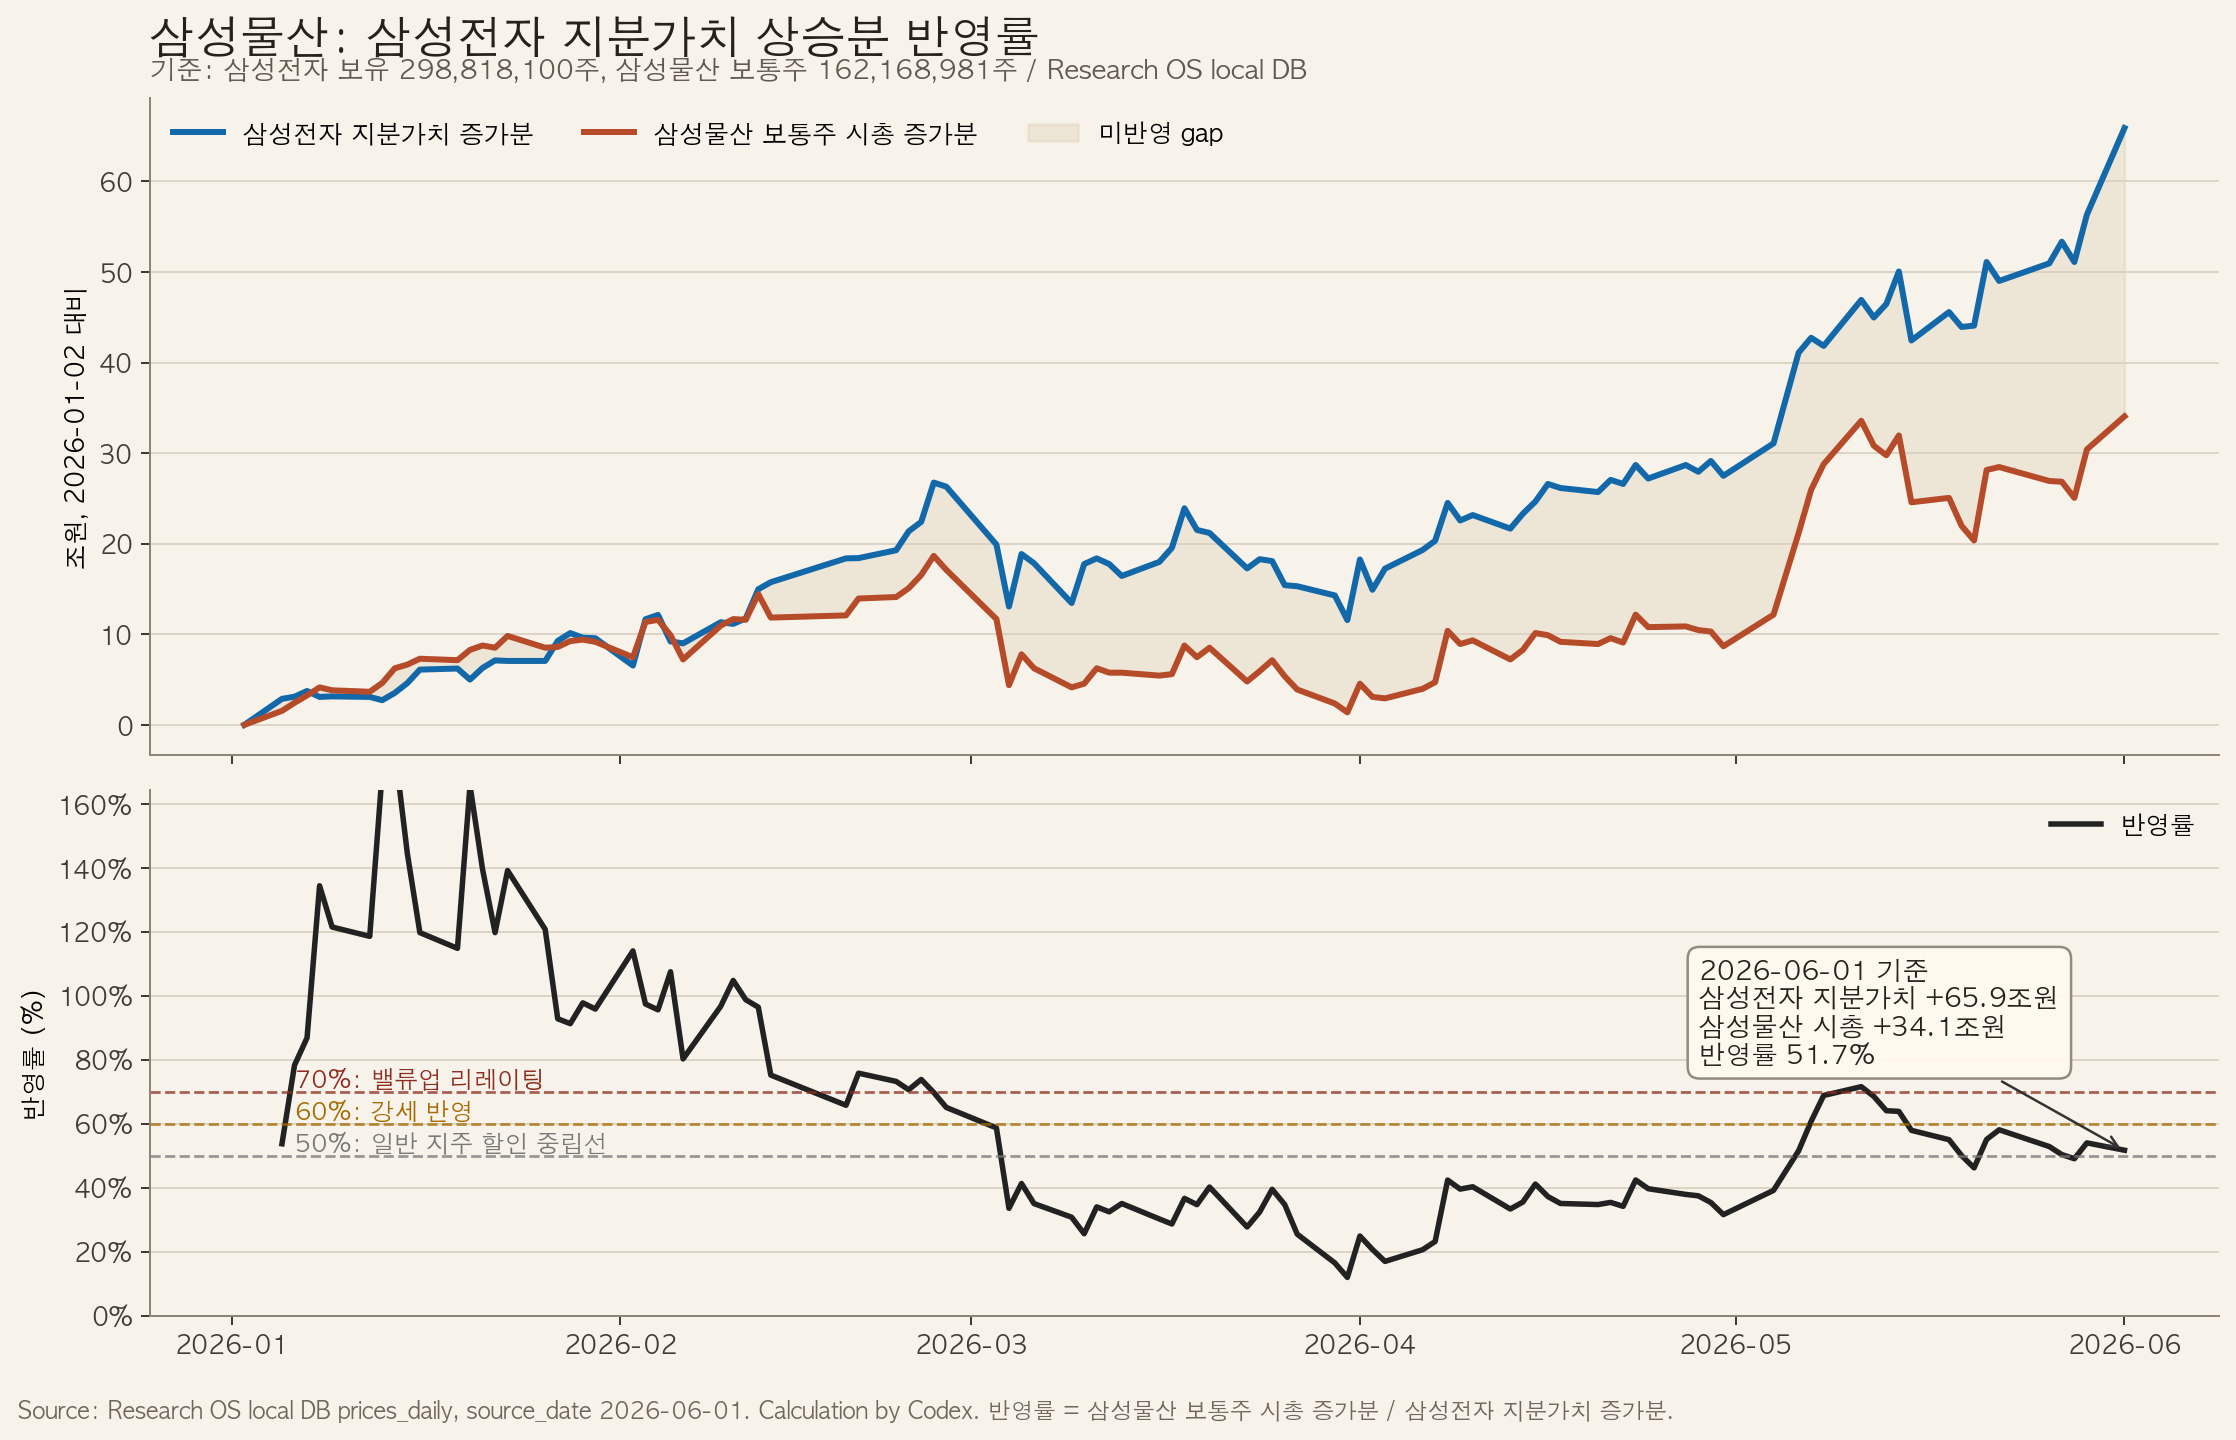
Samsung C&T owns 298,818,100 Samsung Electronics shares. As of June 1, 2026, that stake was worth about KRW 104.3 trillion. Since the start of 2026, the value of Samsung C&T’s Samsung Electronics stake increased by about KRW 65.9 trillion, while Samsung C&T’s common-share market cap increased by about KRW 34.1 trillion. That means Samsung C&T’s common equity has reflected about 51.7% of the YTD increase in its Samsung Electronics stake value.
Samsung C&T is also not a structural high-beta substitute for Samsung Electronics. Using 2026 YTD daily returns, the correlation between Samsung Electronics and Samsung C&T is 0.82, while Samsung C&T’s beta to Samsung Electronics is 0.83. The recent 20-trading-day beta rose to 1.10, so it behaved like a high-beta proxy in the short run, but the longer-term structure is closer to 0.7-0.9x Samsung Electronics sensitivity.
So the current price does not ignore Samsung Electronics. Some of the rerating has already happened. But the pass-through ratio was 71.6% on May 11 and fell to 51.7% by June 1 because Samsung Electronics rallied much faster than Samsung C&T. If the ratio recovers to 60%, the implied Samsung C&T price is about KRW 489,000. A 70% pass-through implies about KRW 529,000, but that requires more than Samsung Electronics beta: governance, Value-Up, capital returns, or operating improvement must help.
The ETF single-stock cap thesis is only partly right. KODEX 200 held Samsung Electronics at 32.87% as of June 1, so KOSPI200 ETFs do not mechanically need to cap Samsung at 30% and buy Samsung C&T instead. But KODEX Samsung Group did reduce Samsung Electronics share count and increase Samsung C&T, Samsung Life, and Samsung SDI share counts from May 21 to June 1. That supports some Samsung Group ETF / active NAV-proxy demand, not a clean KOSPI200 cap trade.
The instruments should be separated. Samsung Electronics common stock is the core AI-memory exposure. Samsung C&T is a NAV gap trade. Samsung Electronics 2x single-stock ETFs are short-term tactical tools. After Samsung Electronics rose 10.1% in one day and 58.3% over 20 trading days, chasing the 2x ETF is the highest-risk expression.
My view: Watchlist / buy-the-pullback candidate. Support around KRW 430,000-440,000 is the first entry zone. A breakout above KRW 465,000 with higher turnover and continued foreign/institutional buying would confirm the trend. The first target is the 60% pass-through line around KRW 489,000; the bull case is the 70% line near KRW 529,000.
1. The Question: Is Samsung C&T Delayed Samsung Electronics Beta?
The investment question is simple:
After Samsung Electronics rerated on AI, HBM and the memory supercycle, can Samsung C&T catch up as a delayed NAV proxy?
Samsung C&T directly owns Samsung Electronics shares. When Samsung Electronics rises, Samsung C&T’s net asset value rises. But the market does not value Samsung C&T like a Samsung Electronics ETF. Samsung C&T also has construction, trading/investment, fashion, resort, Samsung Biologics exposure, governance premium/discount, and conglomerate complexity.
The right question is therefore not “Does Samsung C&T own Samsung Electronics?” It is:
How much of the increase in Samsung Electronics stake value does Samsung C&T’s common equity market cap recognize?
I use this formula:
Pass-through ratio =
Samsung C&T common market-cap increase /
increase in the Samsung Electronics stake value held by Samsung C&T
Data basis:
| Item | Basis |
|---|---|
| Prices and flows | Research OS local DB, June 1, 2026 |
| Samsung Electronics shares held by Samsung C&T | 298,818,100 shares, Samsung Electronics Q1 2026 report |
| Samsung C&T common shares | 162,168,981 shares, Samsung C&T IR ownership page as of March 31, 2026 |
| ETF holdings | KODEX product-pdf API, June 1, 2026 |
| Samsung C&T earnings | Samsung C&T Q1 2026 official earnings release |
[Blocked] This is not a full Samsung C&T sum-of-the-parts model. It does not fully tax-adjust every listed and unlisted asset, model governance-event probability, or value buybacks/dividends. It focuses only on Samsung Electronics proxy beta and the NAV gap trade.
2. Samsung Electronics Is Up 171.6% YTD; Samsung C&T Is Up 85.7%
Research OS local DB, January 2 to June 1, 2026:
| Stock | Jan 2, 2026 | Jun 1, 2026 | YTD |
|---|---|---|---|
| Samsung Electronics | KRW 128,500 | KRW 349,000 | +171.6% |
| Samsung C&T | KRW 245,000 | KRW 455,000 | +85.7% |
| Samsung Life | KRW 156,300 | KRW 410,000 | +162.3% |
| Samsung Biologics | KRW 1,683,000 | KRW 1,377,000 | -18.2% |
| Samsung SDI | KRW 262,500 | KRW 652,000 | +148.4% |
On the surface, Samsung C&T has lagged badly. But that is not enough to call it cheap.
Samsung C&T is not a pure Samsung Electronics holding company. Samsung Biologics’ weakness, construction slowdown, low ROE, strategic-stake illiquidity and conglomerate discount all matter. So Samsung C&T should be treated as a discounted NAV beta, not a 100% Samsung Electronics beta.
3. 51.7% Pass-Through: Reflected, But Not Fully Caught Up
Samsung C&T’s Samsung Electronics stake value:
| Item | Value |
|---|---|
| Samsung Electronics shares held by Samsung C&T | 298,818,100 |
| Stake value on Jan 2, 2026 | about KRW 38.4T |
| Stake value on Jun 1, 2026 | about KRW 104.3T |
| Increase in stake value | +KRW 65.9T |
| Increase in Samsung C&T common market cap | +KRW 34.1T |
| Pass-through ratio | 51.7% |
This is the central number.
Samsung C&T has not ignored the Samsung Electronics stake value. Its common market cap has already increased by more than KRW 34 trillion this year. But Samsung Electronics moved so far that the stake-value increase is now KRW 65.9 trillion, bringing the pass-through ratio down to 51.7%.
Implied Samsung C&T prices by pass-through ratio:
| Pass-through | Implied Samsung C&T price | Interpretation |
|---|---|---|
| 50% | about KRW 448,000 | neutral holding-company discount line |
| 60% | about KRW 489,000 | realistic recovery if Samsung Electronics stays strong |
| 70% | about KRW 529,000 | needs Value-Up / governance rerating |
| 80% | about KRW 570,000 | aggressive assumption |
| 100% | about KRW 651,000 | unrealistic full-cash-equivalent treatment |
At KRW 455,000, Samsung C&T has roughly priced the 50% line. The 60% line still offers a reasonable gap-trade path. The 70% line needs more than Samsung Electronics beta.
4. Why Did Pass-Through Fall From 71.6% to 51.7%?
The key period is after May 11.
| Date | Samsung Electronics | Samsung C&T | Stake-value increase | C&T market-cap increase | Pass-through |
|---|---|---|---|---|---|
| May 11, 2026 | KRW 285,500 | KRW 452,000 | +KRW 46.9T | +KRW 33.6T | 71.6% |
| Jun 1, 2026 | KRW 349,000 | KRW 455,000 | +KRW 65.9T | +KRW 34.1T | 51.7% |
Change from May 11 to June 1:
| Item | Change |
|---|---|
| Samsung Electronics price | +22.2% |
| Samsung C&T price | +0.7% |
| Samsung Electronics stake-value increase | +KRW 19.0T |
| Samsung C&T market-cap increase | +KRW 0.5T |
The pass-through ratio collapsed mainly because Samsung Electronics became the denominator. Samsung Electronics ran, Samsung C&T did almost nothing.
That is the opportunity. If the market accepts the new Samsung Electronics price level and looks for Samsung Group NAV proxies, Samsung C&T can move from the low-50s pass-through ratio back toward 60%. If Samsung Electronics corrects, however, the gap disappears quickly.
5. Samsung C&T Is Discounted NAV Beta, Not Structural High Beta
The added question is price sensitivity. Samsung C&T does move with Samsung Electronics, but structurally it has not been a higher-beta substitute.
Research OS local DB daily-return relationships:
| Period | Samsung Electronics return | Samsung C&T return | Correlation | Beta to Samsung Electronics | Upside capture | Downside capture |
|---|---|---|---|---|---|---|
| 1 year | +514.4% | +200.7% | 0.68 | 0.72 | 0.63 | 0.61 |
| 2026 YTD | +171.6% | +85.7% | 0.82 | 0.83 | 0.73 | 0.80 |
| Last 60D | +82.2% | +55.3% | 0.83 | 0.87 | 0.81 | 0.86 |
| Last 20D | +58.3% | +52.4% | 0.87 | 1.10 | 0.93 | 0.94 |
Three points matter.
First, Samsung C&T has a high probability of moving with Samsung Electronics. The YTD correlation is 0.82 and the last-20D correlation is 0.87.
Second, over longer windows it moves less. The 1-year beta is 0.72, YTD beta is 0.83 and 60D beta is 0.87. The recent 20D beta of 1.10 looks more like an exceptional window when Samsung Electronics momentum and Samsung Group NAV trading overlapped.
Third, the felt experience can be poor. YTD upside capture is 0.73 while downside capture is 0.80. In other words, there are windows where Samsung C&T participates less on the upside but still takes similar downside.
YTD up/down day asymmetry:
| Condition | Result |
|---|---|
| Samsung Electronics up days | 58 days |
| Samsung C&T also up | 45 days, 77.6% |
| Samsung C&T underperformed Samsung Electronics on Samsung Electronics up days | 41 days, 70.7% |
| Samsung Electronics down days | 41 days |
| Samsung C&T also down | 30 days, 73.2% |
| Samsung C&T fell more than Samsung Electronics on Samsung Electronics down days | 18 days, 43.9% |
The phrase “it rises less and falls more” is only half right. It clearly tends to rise less. It does not consistently fall more. But because downside capture can be higher than upside capture, investors can experience it as a bad beta.
On sharp Samsung Electronics selloffs, the risk is real. Across 12 YTD days when Samsung Electronics fell more than 3%, Samsung Electronics averaged -6.62% and Samsung C&T averaged -5.68%. On some days, such as May 15, Samsung Electronics fell 8.6% while Samsung C&T fell 10.3%.
It Is Not a Pure Samsung Electronics Proxy
Samsung C&T also moves with Samsung Life, Samsung Biologics and the broader Samsung Group NAV / governance basket.
| Comparison | YTD correlation with Samsung C&T |
|---|---|
| Samsung Electronics | 0.82 |
| Samsung Life | 0.79 |
| Samsung Biologics | 0.58 |
| Samsung SDI | 0.35 |
Over the last 60 trading days, Samsung C&T’s correlation with Samsung Life was 0.84, slightly higher than its 0.83 correlation with Samsung Electronics. The cleaner frame is therefore Samsung Group NAV basket, not pure Samsung Electronics proxy.
6. Samsung Electronics, Samsung C&T and Samsung Electronics 2x ETFs
There are three ways to express a Samsung Electronics upside view:
| Instrument | Samsung Electronics common | Samsung C&T | Samsung Electronics 2x single-stock ETF |
|---|---|---|---|
| Essence | direct AI memory / semiconductor exposure | Samsung Group NAV / stake-value discount | 2x daily Samsung Electronics return |
| Sensitivity to Samsung Electronics | 1.0x | YTD 0.83x, last 20D 1.10x | target 2.0x |
| Long-term holding fit | high | medium | low |
| Sideways market | neutral | depends on NAV/flows | unfavorable, volatility decay |
| Sharp rally | direct beneficiary | lagging catch-up possible | strongest |
| Sharp selloff | direct loss | worse if discount widens | roughly 2x loss |
| Investment logic | earnings / EPS revisions | pass-through recovery | short-term directional trade |
KODEX Samsung Electronics Single-Stock Leverage ETF tracks the KRX Samsung Electronics Leverage Index and targets positive 2x daily Samsung Electronics exposure. K-ETF lists its inception date as May 27, 2026 and total fee as 0.29%. (K-ETF)
Since listing, the 4-trading-day move worked as intended:
| Product | May 27 close | Jun 1 close | Return |
|---|---|---|---|
| Samsung Electronics | KRW 307,000 | KRW 349,000 | +13.7% |
| Samsung C&T | KRW 410,500 | KRW 455,000 | +10.8% |
| KODEX Samsung Electronics 2x | KRW 22,830 | KRW 29,350 | +28.6% |
| TIGER Samsung Electronics 2x | KRW 21,080 | KRW 27,185 | +29.0% |
That said, four trading days is too short to judge long-term tracking quality.
The core risk in leveraged ETFs is daily rebalancing and negative compounding. Kiwoom Securities notes that single-stock leveraged products rebalance near the close, can amplify volatility, and can lose value through negative compounding even if the underlying stock ends flat after moving up and down. In other words, they are tactical trading tools. (Kiwoom ETF Spot Note)
Simple illustration:
| Samsung Electronics path | Samsung Electronics common | 2x ETF theoretical value |
|---|---|---|
| +10% once | +10% | about +20% |
| -10% once | -10% | about -20% |
| +10%, then -9.1%, back to flat | about 0% | about -1.8% |
| -10%, then +11.1%, back to flat | about 0% | about -2.2% |
Practical conclusion:
| Objective | Preferred instrument | Reason |
|---|---|---|
| Core AI-memory exposure | Samsung Electronics common | most direct thesis and earnings source |
| Lagging gap after Samsung Electronics rally | Samsung C&T | stake-value pass-through recovery |
| Strong 3-10 trading-day directional trade | Samsung Electronics 2x ETF | highest capital efficiency, strict stop required |
| Holding beyond one month | Samsung Electronics > Samsung C&T | 2x ETF has decay/rebalancing risk |
| Defensive posture in correction | Samsung Electronics common | Samsung C&T can suffer discount widening; 2x magnifies losses |
Portfolio-manager version:
Use Samsung Electronics common to own AI memory without unnecessary structural risk. Use Samsung C&T for delayed NAV recognition after Samsung’s rally. Use the 2x ETF only in a high-conviction short-term breakout.
7. The ETF Cap Trade Is Only Half Right
Some investors argue that ETFs cannot hold Samsung Electronics above 30%, so they must buy Samsung C&T as a substitute. That is weak for KOSPI200 ETFs, but partly visible in Samsung Group ETFs.
KOSPI200 ETFs Can Hold Samsung Above 30%
Korean ETF rules generally limit single-security exposure to 30% of assets. But ETFs tracking designated indexes can hold a stock above 30% if the stock itself exceeds 30% of the index. KOSPI, KOSPI200, KOSDAQ150, KRX300 and MSCI Korea are included. (KOFIA)
So KOSPI200 ETFs do not mechanically need to cut Samsung Electronics at 30%.
KODEX 200, June 1, 2026:
| Stock | Weight | Shares |
|---|---|---|
| Samsung Electronics | 32.87% | 7,022 |
| SK Hynix | 28.73% | 834 |
| Samsung C&T | 0.93% | 145 |
Samsung Electronics is already above 30%. From May 11 to June 1, KODEX 200’s Samsung Electronics and Samsung C&T share counts stayed unchanged. There is no evidence here of a KODEX 200 cap-driven substitution into Samsung C&T.
Samsung Group ETF Shows Some Proxy Demand
KODEX Samsung Group looks different:
| Date | Samsung Electronics weight/shares | Samsung C&T weight/shares | Samsung Life weight/shares | Samsung SDI weight/shares |
|---|---|---|---|---|
| May 21, 2026 | 35.37% / 3,244 | 10.27% / 702 | 7.25% / 588 | 9.28% / 412 |
| Jun 1, 2026 | 30.22% / 3,109 | 9.51% / 717 | 7.23% / 607 | 8.97% / 425 |
Samsung Electronics share count fell, while Samsung C&T, Samsung Life and Samsung SDI share counts rose. That supports some Samsung Group proxy/rebalancing demand.
KODEX Samsung Group Value did not show the same share-count change:
| Date | Samsung Electronics weight/shares | Samsung C&T weight/shares | Samsung Life weight/shares |
|---|---|---|---|
| May 21, 2026 | 28.30% / 2,216 | 9.17% / 535 | 8.92% / 618 |
| Jun 1, 2026 | 26.40% / 2,216 | 8.70% / 535 | 9.02% / 618 |
Here the share counts were largely unchanged; weights moved mainly because prices moved.
The right summary:
| Thesis | Verdict |
|---|---|
| KOSPI200 ETFs buy Samsung C&T because Samsung Electronics is capped at 30% | Weak |
| Samsung Group ETFs show Samsung Electronics trimming and Samsung C&T proxy demand | Partly confirmed |
| Active/foreign investors use Samsung C&T as a Samsung Group NAV proxy after Samsung Electronics’ surge | Supported by flow |
8. Flows Are Constructive: Retail Sells, Foreigners and Institutions Absorb
Samsung C&T flows from May 14 to June 1, 2026:
| Investor | Net Buy |
|---|---|
| Foreigners | +KRW 58.6bn |
| Institutions | +KRW 101.0bn |
| Financial investment | +KRW 20.3bn |
| Investment trusts | +KRW 11.1bn |
| Private funds | +KRW 10.1bn |
| Pension funds etc. | +KRW 32.8bn |
| Retail | -KRW 116.5bn |
| Quality institutions | +KRW 80.8bn |
This is a constructive handoff. Retail sold; foreigners and institutions absorbed the supply. Pension funds, investment trusts and private funds all participated.
If this were purely ETF/AP mechanical flow, financial investment would likely dominate. It does not. The better interpretation is:
Not “ETFs are mechanically forced to buy Samsung C&T,” but “foreign and institutional investors are beginning to re-read Samsung C&T as a Samsung Group NAV proxy after Samsung Electronics’ surge.”
9. Why Not Give It a 70% Pass-Through Immediately?
Samsung C&T is not only a Samsung Electronics stake. It has operating businesses and NAV discounts.
Samsung C&T Q1 2026:
| Item | Q1 2026 |
|---|---|
| Revenue | KRW 10.466T |
| Operating profit | KRW 720.0bn |
| YoY operating-profit change | -KRW 4.0bn |
| QoQ operating-profit change | -KRW 102.0bn |
Segment view:
| Segment | Q1 2026 revenue | Q1 2026 operating profit | Read-through |
|---|---|---|---|
| Construction | KRW 3.413T | KRW 111.0bn | slowed on large-project completion and one-off costs |
| Trading/investment | KRW 4.114T | KRW 109.0bn | improved on steel, fertilizer, non-ferrous metals and solar development |
| Fashion | KRW 573.0bn | KRW 38.0bn | improved on better consumption and new products |
| Resort | KRW 930.0bn | -KRW 21.0bn | one-off costs despite food-service expansion |
Discount factors:
- Construction slowdown.
- Samsung Biologics weakness offsets part of NAV.
- Consensus 2026F ROE is only 5.15%.
- Samsung Electronics stake is strategic, not freely monetizable or distributable.
- Conglomerate / holding-company discount.
That is why 60% pass-through is a realistic gap trade, while 70% requires a separate catalyst.
10. Investment View: Watchlist / Buy-the-Pullback Candidate
| Item | View |
|---|---|
| Thesis direction | Valid |
| Current price | Neutral to conditional buy |
| Near-term opportunity | 60% pass-through recovery gap trade |
| Strong upside condition | 70%+ pass-through via Value-Up / governance / operating improvement |
| Main risk | Samsung Electronics correction, operating discount, ETF demand exhaustion |
Entry
| Condition | Meaning |
|---|---|
| KRW 430,000-440,000 support | pullback-buy candidate |
| Break above KRW 465,000 with higher turnover | trend confirmation |
| Continued foreign + institutional buying | proxy trade confirmation |
| KODEX Samsung Group keeps increasing Samsung C&T share count | ETF/theme demand confirmation |
| Samsung Electronics stays strong while C&T pass-through stays in the low-50s | gap-trade entry |
Targets
| Scenario | Implied Samsung C&T price | Condition |
|---|---|---|
| 50% pass-through | about KRW 448,000 | current neutral line |
| 60% pass-through | about KRW 489,000 | Samsung Electronics strength + NAV gap recovery |
| 70% pass-through | about KRW 529,000 | Value-Up / operating improvement / discount compression |
Invalidation
- Samsung Electronics breaks its 20-day moving average or momentum fades sharply.
- Samsung C&T falls below KRW 410,000.
- Foreigners and institutions become joint sellers.
- KODEX Samsung Group stops increasing, or reduces, Samsung C&T share count.
- Q2 2026 construction weakness expands and trading/fashion cannot offset it.
- Samsung Electronics corrects 10% and Samsung C&T also takes an 8-11% Samsung Group NAV-beta loss.
Final View
Samsung C&T is not a clean substitute for Samsung Electronics. If the goal is pure Samsung Electronics exposure, buying Samsung Electronics is cleaner. But Samsung Electronics moved so fast that Samsung C&T’s stake-value pass-through fell to the low-50s. That creates a real NAV gap.
My conclusion:
Samsung C&T is a valid lagging Samsung Electronics proxy. But it is not a high-beta substitute for Samsung Electronics. It is a NAV gap trade that asks whether 51.7% pass-through can recover toward 60%.
If Samsung Electronics stays strong and Samsung C&T breaks KRW 465,000 with volume, the first gap target is around KRW 489,000. If Samsung Electronics pauses or Samsung C&T’s operating discount widens, the 50% pass-through line may simply become the new normal.
Evidence Ledger
| Item | Detail | Source |
|---|---|---|
| Samsung Electronics shares held by Samsung C&T | 298,818,100 shares | Samsung Electronics 2026 Q1 Interim Business Report |
| Samsung C&T common shares | 162,168,981 shares as of Mar 31, 2026 | Samsung C&T IR ownership page |
| Prices and flows | Daily prices and investor flows for Samsung Electronics, Samsung C&T, Samsung Life and peers | Research OS local DB, Jun 1, 2026 |
| Consensus | 2026F P/E 26.8x, P/B 1.32x, ROE 5.15%, target price KRW 463,462 | Research OS local DB consensus_daily, source naver |
| ETF holdings | KODEX 200, KODEX Samsung Group, KODEX Samsung Group Value holdings and share counts | KODEX 200, KODEX Samsung Group, KODEX Samsung Group Value |
| ETF rule | designated-index ETFs can hold index constituents above 30% if index weight exceeds 30% | KOFIA |
| Samsung C&T Q1 2026 earnings | Revenue KRW 10.466T, operating profit KRW 720.0bn | Samsung C&T Newsroom |
| Samsung Electronics 2x ETF | targets 2x daily KRX Samsung Electronics Leverage Index return; listed May 27, 2026; total fee 0.29% | K-ETF |
| Single-stock leverage risk | daily rebalancing, volatility amplification, negative compounding, tactical-use warning | Kiwoom ETF Spot Note |
Fact / Inference / Speculation / Blocked
[Fact]
- Samsung C&T owns 298,818,100 Samsung Electronics shares. (1)
- Research OS calculations put Samsung C&T’s YTD Samsung Electronics stake-value pass-through at 51.7% as of June 1, 2026.
- Samsung C&T’s YTD daily-return correlation with Samsung Electronics is 0.82 and beta to Samsung Electronics is 0.83.
- Over the last 20 trading days, Samsung C&T’s beta to Samsung Electronics rose to 1.10.
- KODEX 200 held Samsung Electronics at 32.87% and Samsung C&T at 0.93% as of June 1, 2026. (2)
- KODEX Samsung Group reduced Samsung Electronics share count and increased Samsung C&T, Samsung Life and Samsung SDI share counts from May 21 to June 1. (3)
- Samsung C&T Q1 2026 operating profit was KRW 720.0bn. (6)
- KODEX Samsung Electronics Single-Stock Leverage ETF targets positive 2x daily Samsung Electronics exposure. (7)
[Inference]
- Samsung Electronics’ sharp move created a lag in Samsung C&T’s NAV recognition, making a 60% pass-through recovery trade plausible.
- Samsung C&T is better understood as a Samsung Group NAV basket than as a pure high-beta Samsung Electronics substitute.
- Samsung Group ETF and active NAV-proxy demand explain the flows better than a pure KOSPI200 ETF cap trade.
- A 70%+ pass-through ratio requires more than Samsung Electronics beta.
- Samsung Electronics 2x ETFs can be useful for 3-10 day tactical trades but are poor long-horizon substitutes because of decay and rebalancing risk.
[Speculation]
- If Samsung Electronics remains strong, Samsung C&T could rerate toward the KRW 489,000 line.
- Active and foreign investors may increasingly use Samsung C&T as a Samsung Group NAV proxy.
[Blocked]
- Full tax-adjusted SOTP of all Samsung C&T listed/unlisted assets.
- Actual monetizability of the Samsung Electronics stake and governance-event probability.
- ETF AP creation/redemption and actual intraday trade attribution.
Disclaimer: For research and information purposes only. Not investment advice. Names cited are for analytical illustration; readers should perform their own due diligence and consult licensed advisors before any investment decision.