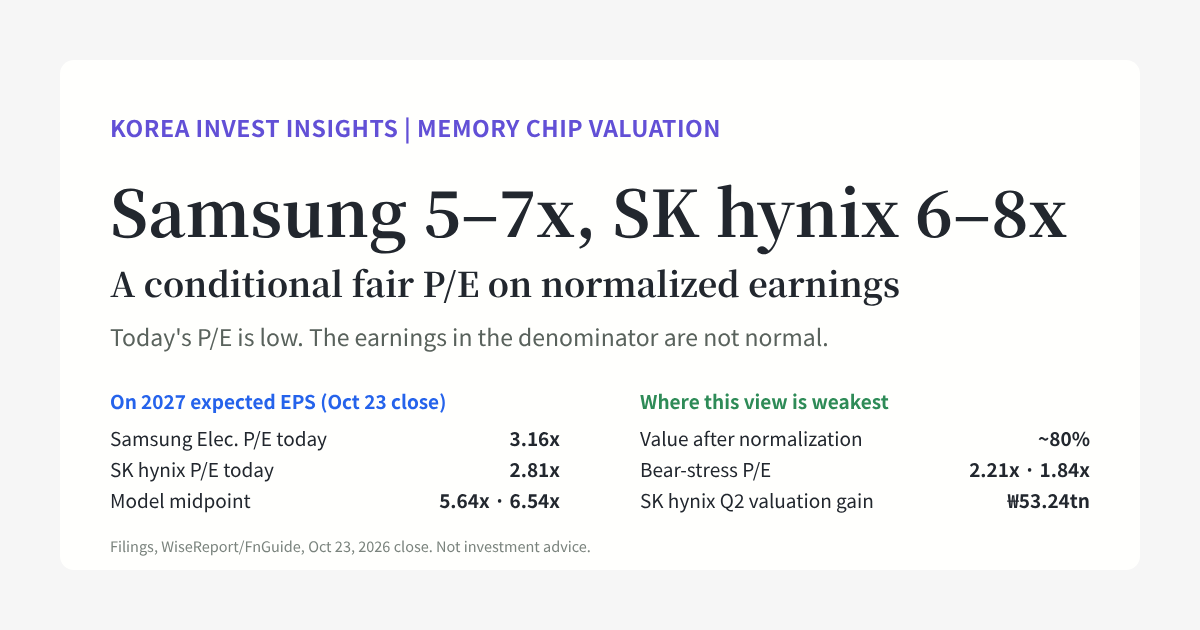
On 2027 expected EPS, we put a conditional fair P/E at 5–7x for Samsung Electronics and 6–8x for SK hynix. Both are cyclical companies whose demand has become structurally larger. It is hard to value them on past memory cycles alone. It is just as hard to give them the multiples of NVIDIA or TSMC at this stage.
Prices are the regular-session close on October 23, 2026. Korean EPS comes from the WiseReport/FnGuide consensus collected the same day. The fair range is not a market consensus. It is our judgment, built from the assumptions below.
| Samsung Electronics | SK hynix | |
|---|---|---|
| Close | ₩215,500 | ₩1,277,000 |
| 2027 expected EPS | ₩68,241 | ₩453,943 |
| Current P/E (recomputed) | 3.16x | 2.81x |
| Fair P/E in this analysis | 5–7x | 6–8x |
| Model midpoint | 5.64x | 6.54x |
| P/E on normalized later EPS | 10–12x | 11–13x |
The 5–7x and the 10–12x do not contradict each other. The first sits on high 2027 earnings. The second sits on the lower, normalized earnings that follow.
Five things to take away
- The debate is not whether the cycle is gone. It is how much profit is left after normalization. HBM and long-term contracts make earnings more visible. New supply, yield gains, product transitions and price renegotiation all remain.
- Today’s 3.16x and 2.81x are a question, not proof of cheapness. The denominator is peak earnings. To make the price fit our base model, normalized EPS would have to fall to about 25% of 2027 for Samsung and about 18% for SK hynix. That is a back-solved number, not the market’s earnings forecast.
- Our base case is also optimistic. About 80% of the computed value comes from the period after the end of 2028.
- SK hynix’s Q2 net profit of ₩93.92tn includes ₩53.24tn of valuation gains on financial instruments. Do not read it as recurring operating profit.
- A low P/E is not a floor. In the bear stress, the fair multiple falls to 2.21x for Samsung and 1.84x for SK hynix.
The issue is the profit left after normalization, not the end of the cycle
What has changed is clear. Demand now rests on AI servers. HBM is a complex product that needs customer qualification. Equipment and packaging are constrained, and long-term contracts and prepayments now exist. Together these can make earnings visible for longer than before.
What remains is just as clear. Commodity products substitute for each other. Wafer allocation, new supply and yield gains react with a lag, and customers face their own return limits. Even HBM is contested and repriced at each generation.
Long-term contracts must be read in three parts: volume, price range and renegotiation terms. Micron’s filing is a good example. Its strategic customer agreements are take-or-pay with binding volumes, but pricing is either fixed or periodically negotiated, and for most agreements it sits inside minimum and maximum bands.1
So we avoid both extremes. “AI demand keeps growing, so today’s excess profit lasts forever” is too much. “Memory is cyclical, so 2–3x is always the right multiple” ignores cash that comes back and the chance that normal earnings settle higher.
The width of past cycles shows why the normalization assumption matters. Samsung’s consolidated operating margin fell from 24.2% in 2018 (₩58.89tn ÷ ₩243.77tn) to 2.5% in 2023 (₩6.57tn ÷ ₩258.94tn). SK hynix went from 51.5% in 2018 (₩20.84tn ÷ ₩40.45tn) to an operating loss of 23.6% in 2023 (₩7.73tn loss ÷ ₩32.77tn revenue).2
Both companies are larger now, so we do not use the absolute average of past profit. We estimate the price, margin and cash conversion that can hold at today’s scale, and we do not assume normalization happens all at once.34
Samsung has many business lines, but its current profit is not diversified. Q2 profit in the DS (chip) division was ₩89.2tn, about 99.7% of consolidated operating profit of ₩89.5tn.5 It is hard to argue that non-memory businesses offset today’s memory cycle. Net cash and a possible recovery outside memory are a separate cushion. For SK hynix, we credit the quality of HBM and server memory, but product concentration remains a risk.6
Six companies, six multiples: the gap tracks how long earnings are defended
The table below compares earnings near 2027. It is a reference, not a ranking. Korea uses WiseReport/FnGuide consensus and the US uses yfinance. For NVIDIA and Micron we calendarized fiscal-year estimates. We could not confirm whether US EPS is GAAP or adjusted, or the date of the TSM estimate. Do not read this as a precise comparison of relative undervaluation.
| Company | Oct 23 close | Source EPS and period | Price ÷ EPS | Calendar-2027 approx. |
|---|---|---|---|---|
| Samsung Electronics | ₩215,500 | CY2027 ₩68,241; CY2028 ₩76,413 | 3.16x | 3.16x |
| SK hynix | ₩1,277,000 | CY2027 ₩453,943; CY2028 ₩500,960 | 2.81x | 2.81x |
| Micron | $877.55 | FY2027 $176.55; FY2028 $206.89 | 4.97x; 4.24x | about 4.70x |
| NVIDIA | $210.96 | FY2027 $9.31; FY2028 $15.92 | 22.65x; 13.26x | about 13.73x |
| TSM ADR | $418.51 | CY2027 $23.39 | about 17.89x | about 17.89x |
| Intel | $86.96 | FY2027 $2.11 | about 41.17x | about 41.17x, limited meaning |
Our calendar-year approximation for NVIDIA is (FY27 EPS + 11 × FY28 EPS) ÷ 12 = $15.36. For Micron it is (8 × FY27 EPS + 4 × FY28 EPS) ÷ 12 = $186.66. This assumes profit accrues evenly by month and is not a supplier consensus for the calendar year. Do not read the P/Es here as one common forward basis.
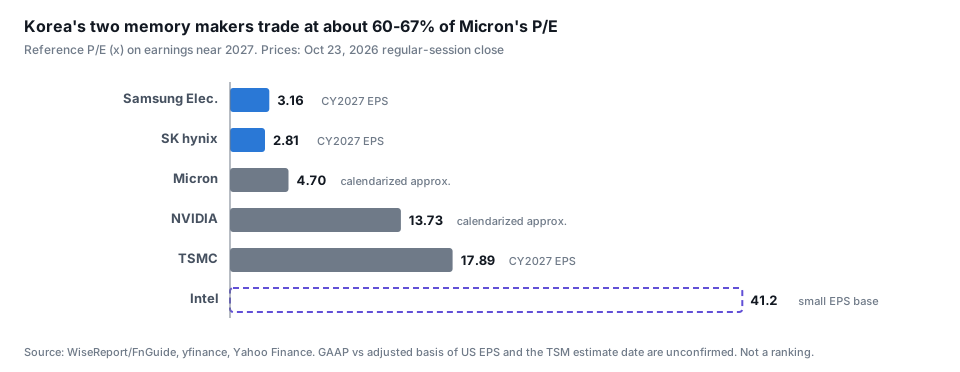
What to see in the figure: the two Korean memory makers trade at about 60–67% of Micron’s P/E. A similar multiple does not mean similar value, though. A multiple depends on how long, and how reliably, earnings are defended.
| Company | What supports the multiple | What limits it |
|---|---|---|
| Samsung Electronics | Memory scale, HBM expansion, net cash and capital-allocation room | Profit concentrated in memory today, commodity memory, non-memory profitability |
| SK hynix | HBM and server memory, co-design with customers, long-term contracts | Memory concentration, generation-by-generation competition, commodity prices and capacity, non-operating gains |
| Micron | HBM and leading-edge memory, contracts and cash generation | Normalization of record prices and margins, heavy investment |
| NVIDIA | Switching costs across CUDA, tools, networking and systems; fabless model | AI capex concentration, customers’ own ASICs, receivables, export controls |
| TSMC | Leading-edge process, yield, customer design ties, a manufacturer that does not compete with customers | Capital intensity, overseas fab costs, geopolitics |
| Intel | Option value if the CPU recovery and outside foundry customers work out | Small EPS base, losses, cash needs, dilution |
Micron is the closest comparison. NVIDIA and TSMC show what it takes to defend long-term earnings. They are not a reason to lift Korean memory multiples to their level.
Micron’s fiscal 2026 adjusted free cash flow was $62.31bn, strong cash generation.7 But the $12.75bn of customer deposits received in the same year is scheduled to be repaid almost entirely between 2029 and 2031. If a customer misses its minimum purchase commitment, Micron may keep all or part of the deposit.1 That cash cannot be treated as permanent profit. Differences in US listing, capital allocation and contract structure are fair adjustments, but they do not explain all of the large discount on Korean memory.
NVIDIA’s premium comes not only from GPU demand but from the cost of replacing software, networking and systems together. Still, NVIDIA is not free of the AI investment cycle. It carries customer concentration and receivables risk.8 High margins and switching costs do not remove the cycle. They support the earnings that remain after normalization.
TSMC’s third-quarter operating margin was 58.7%.9 Leading-edge process and customer design ties support earnings durability, but heavy investment and overseas fab costs come with them. Its position as a manufacturer that serves whichever designer wins also matters. To give Samsung’s foundry the same multiple, we would first need evidence on profitability, outside customers and yield.
Intel’s high P/E is not evidence of a better business. In Q2, external customers made up $293m of Intel Foundry’s $5,765m of revenue, about 5%, and the segment’s operating loss was $2,089m.10 The company’s Q2 GAAP loss was $2.16 per share. A small EPS base and a recovery option lifted the multiple, nothing more. A sum-of-the-parts approach fits better: the normal earnings value of the product business, plus the chance that foundry succeeds, minus future cash needs, net debt and dilution.
We split near-term cash from value after normalization
The model below is an earnings-and-cash model built on subjective assumptions. It is not a full company DCF and not a consensus fair value. It converts into present value, separately, the cash that can actually be paid out in 2027–2028 and the value placed on normalized earnings at the end of 2028, then adds them.
Fair P/E today = f ÷ (1+r)^t1 + [f × (E28 ÷ E27) + M × q] ÷ (1+r)^t2
- E27, E28: per-share earnings in 2027 and 2028. Samsung ₩68,241 and ₩76,413; SK hynix ₩453,943 and ₩500,960.
- t1, t2: years from October 23 to the end of 2027 and the end of 2028. They are 1.1882 and 2.1903 years.
- f: the share of 2027–2028 earnings left as distributable cash after reinvestment and conversion friction. It is not an actual payout ratio.
- q: recurring normalized EPS in 2029 divided by 2027 EPS.
- M: the P/E applied to normalized EPS at the end of 2028. It differs from the P/E on high 2027 earnings.
- r: the required return over the transition period.
| Model assumptions and results | Samsung Electronics | SK hynix |
|---|---|---|
| Cash conversion of 2027–2028 earnings (f) | 65% | 70% |
| 2029 normal EPS ÷ 2027 EPS (q) | 55% | 60% |
| Normalized EPS (E29) | ₩37,533 | ₩272,366 |
| Terminal P/E on normalized EPS (M) | 10.5x | 11.5x |
| Required return over the transition (r) | 12.0% | 12.5% |
| PV of 2027–2028 cash ÷ 2027 EPS | 1.136x | 1.205x |
| PV of value after normalization ÷ 2027 EPS | 4.506x | 5.331x |
| Total, fair P/E today | 5.642x | 6.536x |
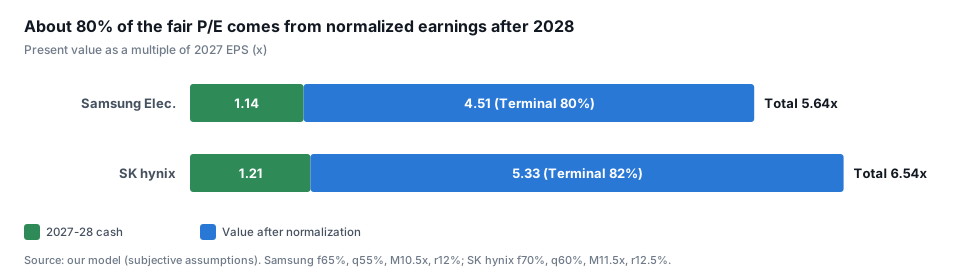
What to see in the table: about 80% of the total is value after normalization. Two assumptions, q and M, decide most of the judgment, not the arithmetic.
The model does not add paid-out cash back into the terminal value. We also define normalized EPS as recurring earnings, excluding interest on cash already paid out and one-time valuation gains. We did not add net cash separately, and we did not value the rest of 2026’s cash flow or excess assets on their own. These are assumptions to avoid double counting, not confirmation of actual capital allocation.
SK hynix’s announced policy is to return more than 50% of cumulative free cash flow over 2025–2027.11 That is not 50% of net profit, and it is not the same concept as the 70% f in the table. Actual payments, buybacks and cancellations must be confirmed before they justify a smaller capital-allocation discount.
The normal P/E is not a simple historical average of today’s peak earnings. With the steady-state formula P/E = (1 − g ÷ ROE) ÷ (ke − g), a normal ROE of 15–30%, long-run growth of 2–3% and a steady-state cost of equity of 10–12% give about 8.7–12.9x. All of these are analytical assumptions.
For SK hynix we used the upper part of the normal range because we credit the differentiation of HBM and server memory. We reflected pure memory concentration through a higher transition discount rate. Samsung has net cash and recovery potential, but we did not pre-pay a TSMC-style premium for its non-memory businesses.
The selected ranges are Samsung q 50–65% and M 10–11.5x, which gives 5.04–6.97x, and SK hynix q 55–70% and M 11–12.5x, which gives 5.88–7.97x. Other variables stay at base values. For ease of use we set Samsung at 5–7x and SK hynix at 6–8x. This range is not a confidence interval.
Our base case also contains optimism
The base case assumes that, even after normalization, a larger business and higher profitability than in the past remain. Holding today’s expected revenue and net-profit relationship fixed, Samsung’s q of 55% equals a net margin of about 26%, and SK hynix’s q of 60% equals about 39%. Samsung is above its past cycle peak, and SK hynix is near its past peak.
At the same time, 2029 normal EPS sits about 51% below the 2028 consensus for Samsung and about 46% below for SK hynix. That assumes a sharp normalization. The actual timing and path of normalization are unconfirmed.
Because about 80% of the computed value leans on terminal assumptions, 5–7x and 6–8x should not be accepted as objectively fixed numbers. Testing how long profit lasts matters most.
For SK hynix, check the quality of net profit first
SK hynix’s Q2 net profit was ₩93.92tn against operating profit of ₩60.54tn. Finance income explains the gap. In the notes to the half-year consolidated statements, Q2 finance income of ₩65.86tn includes ₩53.24tn of gains on valuation of financial instruments and ₩10.03tn of dividend income.12
These cannot be treated as recurring memory operating profit. From public database information alone, we cannot confirm how the 2027–2028 EPS consensus adjusts for such non-operating items. We did not freeze the recent high net margin and ROE, and we did not use them to justify an NVIDIA-level multiple.
P/B is a secondary check. On 2026 expected book value per share it is 1.98x for Samsung (₩215,500 ÷ ₩108,812) and 2.41x for SK hynix (₩1,277,000 ÷ ₩530,869).13 Expected profit surges while book value does not keep pace, so a low 2027 P/E and these P/B levels appear together. We did not justify P/B by freezing 2026 expected ROE, and we did not treat the low end of past P/B as today’s floor. EV/EBITDA can also overstate memory if it ignores heavy maintenance and growth capex.
Today’s price is neither proof of falling earnings nor proof of a floor
The current price is 3.16x of Samsung’s and 2.81x of SK hynix’s 2027 expected earnings. Hold f, r, M and E28 at base values and solve for the q that fits today’s price: about 24.7% for Samsung and about 18.1% for SK hynix. That is a conditional residual of the model. It does not mean the market expects that much of a decline.
It does not confirm a floor either. If EPS is overestimated, cash conversion is lower or the capital-allocation discount is larger, a different mix can explain the same price.
| Scenario | Samsung PV ÷ E27 | SK hynix PV ÷ E27 | Key conditions |
|---|---|---|---|
| Bear stress | 2.21x | 1.84x | E28 ÷ E27 cut to 0.75 and 0.65; q 25% and 20%; cash conversion 50%; normal P/E 8x; discount rate 14% and 15% |
| Base | 5.64x | 6.54x | Assumptions in the table above |
| Bull stress | 10.22x | 11.08x | q 85% and 90%; cash conversion 75% and 80%; normal P/E 13x and 13.5x; discount rate 10.5% and 11% |
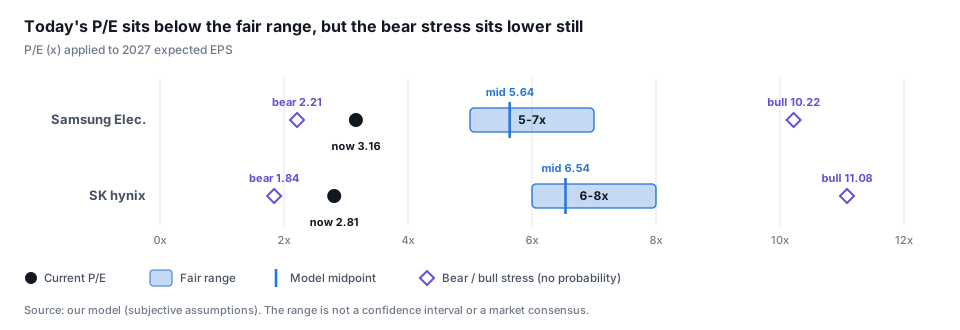
The stress cases are hypothetical paths with no probability attached. The bear value is not a floor on losses. If 2027 and 2028 EPS both fall 30% with the other ratios held, the base value also falls by the same 30%. A low P/E today does not protect against loss. These figures are the arithmetic result of multiple and EPS assumptions, not price targets.
What would change the multiple: post-2028 price, volume and cash
Four things would raise the multiple. Contract price and volume terms after 2028 become specific. Recurring earnings and cash flow are confirmed. Capital allocation is carried out without dilution. Profitability holds after the expected capacity additions.
Four things would lower it. Annual EPS cuts continue. Long-term contract prices are renegotiated or deferred. Commodity DRAM goes into oversupply. Utilization or power runs late. An earnings gap that appears once non-operating items are stripped out belongs on this list too. Raising the multiple on peak earnings does not create value on its own.
We will cross-check price, contracts, capex and recurring profit against the detailed results from SK hynix on October 28 and Samsung on October 29.14 On October 30 we will recheck the EPS consensus and the f, q and M ranges. These dates are research checkpoints and have nothing to do with trade execution.
What we could not confirm
- The accounting basis of US EPS (GAAP or adjusted) and the as-of date of the latest TSM estimate.
- How the Korean 2027–2028 EPS consensus adjusts for non-operating items.
- We did not convert Samsung’s and SK hynix’s consolidated net profit into EPS attributable to owners.
- Contract prices and cash conversion after 2028.
- For Intel, differences in share-count observations remain, so we did not fix EV/Sales or an exact fair P/E.
We cross-checked price ÷ EPS by reverse multiplication, and the discounting model both as a split sum of cash and terminal value and as a single formula. We recomputed the numbers in this post in code before publishing. We rechecked the key figures for Micron, SK hynix, TSMC and Intel against the filings. Company IR material is the company’s own view, and supply-shortage outlooks are management’s outlook. Brokerage and aggregated consensus can carry conflicts of interest and estimation error.
Disclaimer: For research and information purposes only. Not investment advice. Names cited are for analytical illustration; readers should perform their own due diligence and consult licensed advisors before any investment decision.
Micron fiscal 2026 annual report (10-K). Strategic customer agreements are take-or-pay with binding volumes; pricing is fixed or periodically negotiated, and most agreements carry minimum and maximum price bands. Deposits are “scheduled to be repaid” almost entirely between 2029 and 2031, and Micron may retain all or part of a deposit if the customer misses its minimum purchase commitment. ↩︎ ↩︎
Samsung 2018 annual filing and 2023 results; SK hynix 2018 results and financial data. Units are trillions of won. ↩︎
Damodaran, Normalized earnings. Method for estimating normalized earnings. ↩︎
McKinsey, How to value cyclical companies. Scenario approach for cyclical companies. ↩︎
Samsung Electronics Q2 2026 earnings conference materials. DS division operating profit ₩89.2tn; consolidated operating profit ₩89.5tn. ↩︎
SK hynix Q2 2026 business results. Revenue ₩79.3187tn, operating profit ₩60.5426tn, net profit ₩93.9226tn. ↩︎
Micron fiscal Q4 and full-year 2026 results. Adjusted free cash flow was $62,308m for the year and $33,199m for Q4. Proceeds from customer contract liability deposits in the annual cash flow statement were $12,747m. ↩︎
TSMC third quarter 2026 results. Operating margin 58.7%. ↩︎
Intel Q2 2026 results and Form 10-Q. The $293m of Intel Foundry revenue from external customers is from the 10-Q. ↩︎
SK hynix half-year filing (SEC Form 6-K), notes to the consolidated statements. Of Q2 finance income of ₩65,858,814m, gain on valuation of financial instruments was ₩53,237,425m and dividend income was ₩10,027,945m. ↩︎
Samsung Electronics on WiseReport and SK hynix on WiseReport. FnGuide consensus collected on October 23, 2026, including 2027–2028 EPS and 2026 expected book value per share. ↩︎
SK hynix Q3 earnings call notice (October 28, 2026, 9:00 a.m. KST) and Samsung Electronics IR calendar (October 29, 2026, 10:00 a.m. KST). ↩︎