Samsung Electronics closed at ₩220,500 on October 30. That is 4.8x 2026 expected EPS and 3.1x 2027 consensus EPS. The closing high was ₩362,500 on June 18.
A 3x multiple invites the line “this has to be the bottom.” Run the same price backward and you get a different picture. Plug in a normal 8x multiple, and the market is pricing 2028 EPS about 60% below the 2027 estimate. The market does not doubt AI memory profits. It prices 2026-27 as a two-year spike, after which more than half of those profits disappear.
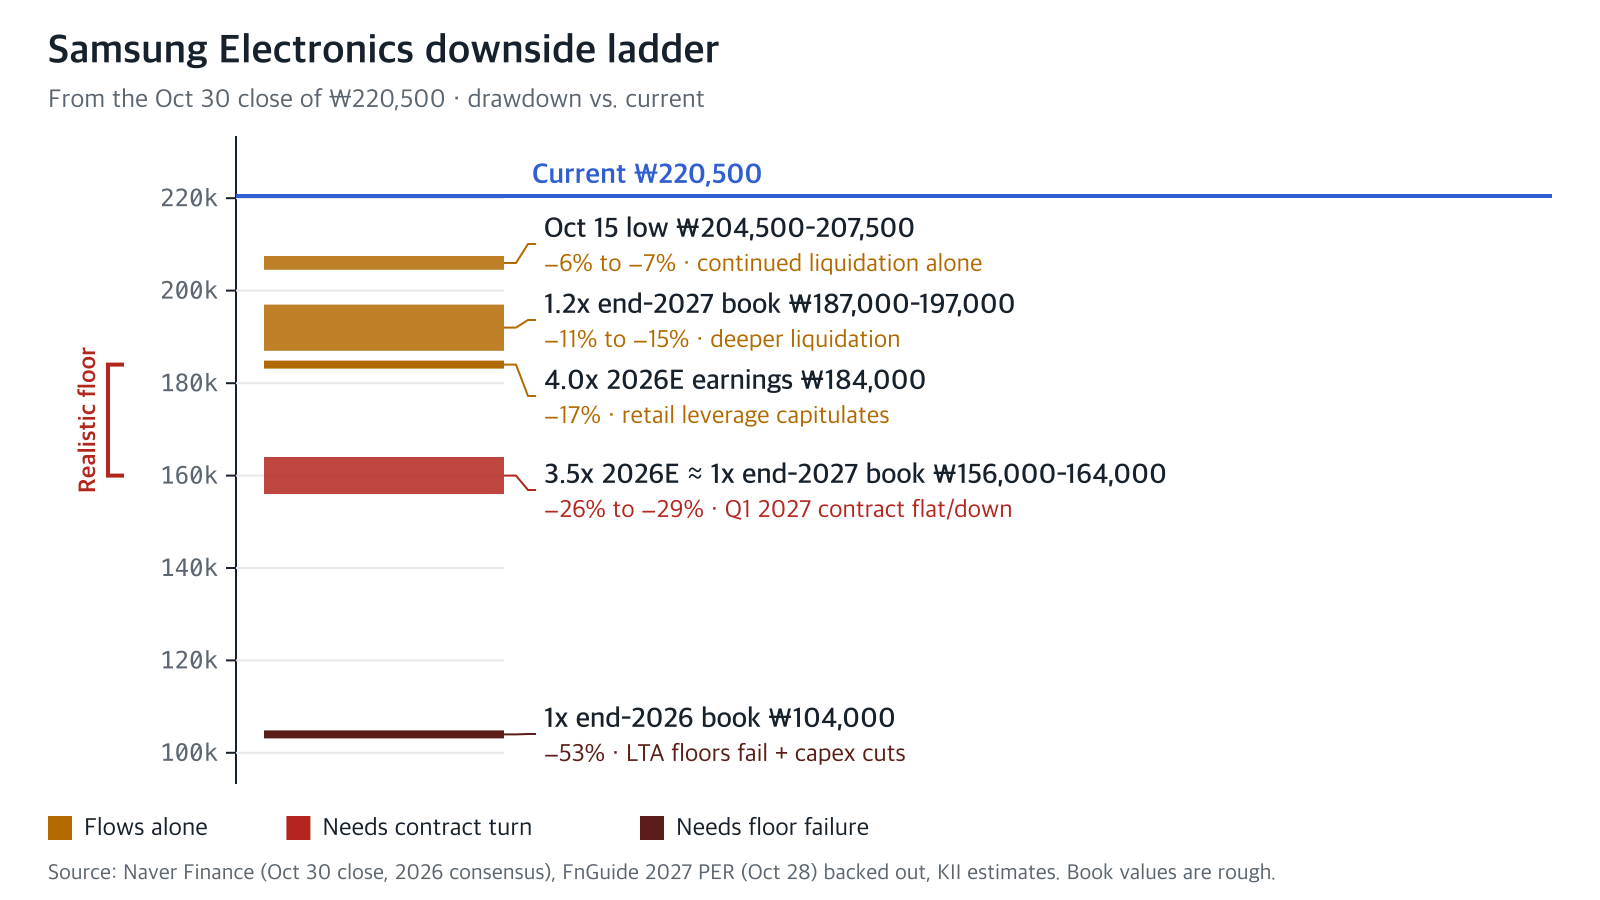
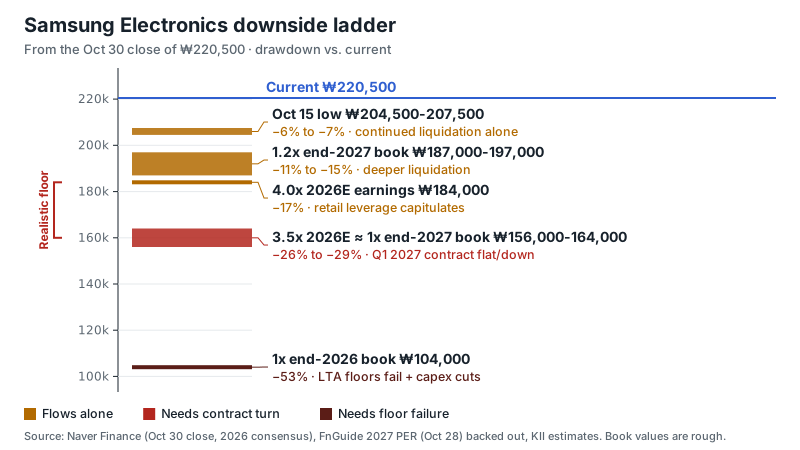
Our view: The stock can fall further. Liquidation flows and a softer Q1 2027 contract price alone can take it to a realistic floor of ₩160,000-184,000 (−17% to −27% from here). The ₩100,000s (1x end-2026 book value) open only if the price floors in long-term agreements (LTAs) actually break and hyperscalers cut 2027 capex, and we see no path for that evidence before the second half of 2027. If Q1 2027 commodity DRAM contract prices keep rising and HBM4 prices step up, this floor call stops mattering; if contract prices turn flat or down, the ₩160,000s open.
- Today’s price embeds a roughly 60% earnings drop in 2028. The October 28 FnGuide 2027 PER of 3.2-3.4x gives 57-60%.
- In the past two cycles, the bottom formed at about 6x peak earnings and about 1x book, after the drop was confirmed. Today the stock is already below that, before any drop is visible.
- The market’s conviction has a basis on direction. It is weak on size and timing, because it sets LTA floors and annual HBM pricing to zero.
- The deciding variables are the direction of Q1 2027 commodity DRAM contract prices and what the late-January board meeting discloses on LTA coverage and HBM4 annual pricing.
Run 3x backward and you get a 60% profit drop in 2028
Start with the earnings each price assumes. The 2026 consensus is from Naver Finance, checked November 1. The 2027 EPS of about ₩72,000 is backed out from FnGuide’s 2027 PER of 3.2x on October 28 (October 29 close: ₩230,500). The 2027 operating profit of ₩555 trillion is Kiwoom Securities’ October 8 estimate.
| Basis | EPS | PER | Source |
|---|---|---|---|
| 2026 consensus | ₩45,983 | 4.8x | Naver Finance compilation |
| 2027 consensus (OP ₩555T) | ~₩72,000 | 3.1x | Backed out from FnGuide, Oct 28 |
| 2027 bull case (OP ₩700T) | ~₩85,000 | 2.6x | Author estimate |
Divide the price by a normal multiple, and you get the earnings the market is paying for.
| Reading | Formula | Result | Meaning |
|---|---|---|---|
| Normal 8x | 220,500 ÷ 8 | 2028 EPS ~₩27,600 | ~62% below 2027E |
| Normal 10x | 220,500 ÷ 10, × 6.74B shares ÷ 0.78 conversion | Normalized OP ~₩190T | ~3.2x the 2018 peak of ₩58.9T |
At 8x, the market’s implied 2028 operating profit is about ₩240-250 trillion (EPS ₩27,600-28,800 × 6.74 billion shares ÷ 0.78). If a 2019-style collapse hits from ₩555 trillion in 2027, 2028 operating profit lands at about ₩210-325 trillion. Today’s price already sits inside that range.
The market is not saying “AI memory profits are fake.” It is saying those profits last two years and then more than half of them go away.
Past bottoms came at 6x after the drop showed; today it is 4.8x before it shows
To see how hard the market is discounting, compare it with past cycles. The historical figures below are the author’s approximations. We did not recheck them against primary data for this piece.
| Date | PER on peak earnings | Price to book | Situation then |
|---|---|---|---|
| Jan 2019 low (~₩36,850) | ~6.1x (2018 EPS ₩6,024) | ~1.0x | After the Q4 profit drop was confirmed |
| Sep 2022 low (~₩51,800) | ~6.4x (2022 EPS ₩8,057) | ~1.0x | After the Q3 guidance cut |
| Nov 2017 high (~₩57,220) | ~8x 2018E | The market doubted the peak, and was right | |
| Jan 2021 high (~₩96,800) | ~17x 2021E | The market was optimistic, and was wrong | |
| Oct 30, 2026 | 4.8x 2026E | 2.56x | Profits still rising (Q3 ₩107T, Q4 consensus ₩116T) |
The two past bottoms formed at about 6x peak earnings, after the drop was visible. Today the stock is at 4.8x before any drop is visible. The discount is deeper than in November 2017 (8x), when the market doubted the peak and was right.
Flows alone can reach ₩160,000-184,000
We built the downside ladder on PER and book value per share (BPS). End-2026 BPS is about ₩104,000: Q2 BPS of ₩86,052, plus Q3 retained earnings (EPS ₩13,504 − dividend ₩4,601), plus Q4 retained earnings (consensus OP ₩116.3T × 0.78 ÷ 6.74B shares ≈ ₩13,460, − dividend of about ₩4,600). End-2027 BPS adds 2027E EPS of ₩72,000 and subtracts ₩12,000-20,000 in dividends (2027 policy not yet announced), for about ₩156,000-164,000. These are rough figures that exclude translation gains and losses and the effect of buybacks.
| Level | Price | vs. current | What it takes |
|---|---|---|---|
| Oct 15 low (close / intraday) | ₩207,500 / ₩204,500 | −6% to −7% | Continued liquidation alone |
| 1.2x end-2027 book | ~₩187,000-197,000 | −11% to −15% | Deeper liquidation, retail leverage capitulates |
| 4.0x 2026E earnings | ~₩184,000 | −17% | Same |
| 3.5x 2026E earnings ≈ 1.0x end-2027 book | ~₩156,000-164,000 | −26% to −29% | Q1 2027 contract prices visibly turn flat or down |
| 1.0x end-2026 book (old-style bottom) | ~₩104,000 | −53% | LTA floors fail and hyperscaler capex cuts are confirmed |
We also priced different 2028 earnings drops, using 2027E EPS of ₩72,000.
| 2028 earnings drop | 2028 EPS | At 6x | At 8x |
|---|---|---|---|
| −30% | ₩50,400 | ₩302,000 | ₩403,000 |
| −60% (what today’s price embeds) | ₩28,800 | ₩173,000 | ₩230,000 |
| −75% | ₩18,000 | ₩108,000 | ₩144,000 |
The ₩160,000-184,000 zone is realistic because flows and sentiment alone can reach it. Going below it requires pricing a 2028 earnings drop of 75% or more. 2027 HBM is sold out at agreed prices, and Q4 commodity DRAM contract prices are still rising 10-15%. In that setting, we see no path for evidence of a 75% drop before the second half of 2027.
Time also lifts the floor. Book value grows by about ₩9,000 per quarter. So the old-style bottom of 1x book rises every quarter.
The market’s conviction is grounded on direction, not on size and timing
Direction rests on the base rate. By the author’s record of past cycles, every memory upcycle of the last 30 years ended with operating profit down 50-85%. The stock turned about 9-15 months before the profit peak (the November 2017 high came before the Q3 2018 profit peak; the January 2021 high came before the first-half 2022 peak). This cycle’s closing high was June 18. Apply the same lead, and the market is calling the profit peak for mid-2027. That is the implicit claim in the price.
These facts support it.
| Fact | Status | Source |
|---|---|---|
| Buyers are building DRAM inventory: 2-9 weeks above normal by end-Q4 | Confirmed | TrendForce (cloud and PC makers), HPE 10-Q |
| Consumer NAND and some DDR4 prices have turned down | Confirmed | Market price survey (Oct 16) |
| Hyperscaler funding is shifting from operating cash to debt and outside capital (Alphabet free cash flow −$9.1B, Meta $97.5B raised, Amazon free cash flow negative) | Confirmed | Company 10-Qs and bond filings |
| FX: about −₩10T to Q3 operating profit, a similar headwind in Q4 | Confirmed | Samsung Newsroom |
| 86% of Samsung’s DRAM revenue is commodity, so it is more exposed to a contract-price turn than SK hynix | Confirmed | Author analysis (Oct 30) |
| CXMT 4F² prototype validated | Partly confirmed (single report) | November 1 report |
The facts against it carry the same weight.
| Fact | Status | Source |
|---|---|---|
| DDR5 16Gb spot flat at $61.50, not falling | Confirmed | Spot price, Oct 31 |
| Q4 commodity DRAM contract prices still rising 10-15% | Confirmed | TrendForce, Sep 30 |
| 2027 estimates raised after Q3 results | Confirmed | Broker estimate compilation |
| 2027 HBM sold out at agreed prices; 10 LTAs signed and 10 in talks; shortage through 2028. SK hynix has sold through 2029 | Confirmed (company statements) | Samsung Q3 IR, SK hynix Newsroom |
| LTA price floors and annual HBM pricing, which did not exist in 2018 or 2022 | Confirmed | July 30 earnings call transcript |
Here is where we stand. The 60% drop priced for 2028 is too much, because it sets LTA floors and the annual contract structure to zero. But no floor has ever held through a downturn. Solar polysilicon prepayment contracts ended in renegotiation and lawsuits. It is rational for the market not to pay for those floors before they are tested. LTAs have locked volume, but nobody has proven they lock a profit floor (our LTA analysis).
So the call is tied to a calendar.
- What flips it up: Q1 2027 contract prices keep rising and HBM4 prices step up. That kills the “2026 peak” thesis, and the stock can return to 5x 2027E or more (₩360,000+).
- What confirms the downside: any one of flat or falling Q1 2027 contract prices, buyer inventory above 9 weeks, or hyperscaler 2027 capex cuts opens the ₩160,000-184,000 zone.
- Until then, declines belong more to flows than to earnings revisions. Chip liquidation is under way, but retail leverage has not capitulated. Hedge fund short leverage is at the 99th percentile of five years in Goldman Sachs prime brokerage data, and US retail bought $9.3 billion of the 3x chip ETF (SOXL) in two weeks.
Contract prices decide the path to the end of Q1 2027
We split the next five months into paths with signals and thresholds. The base paths are A and B. C needs a contract-price turn to open, and D is the tail.
| Path | Signals | Threshold |
|---|---|---|
| A. Flow-driven touch of ₩184,000-207,000, then recovery | Liquidation in progress, retail leverage not capitulated, the October 30 US chip selloff hits Korea on November 2 | Break of the Oct 15 intraday low of ₩204,500 |
| B. Holds above ₩200,000, rerates after the January board and Q1 contract prices | Q4 contract prices +10-15%, 2027 estimates raised, three days of foreign net buying before Oct 29 | Q1 2027 contract prices +5% or more |
| C. Downturn confirmed, ₩160,000-184,000 | Consumer NAND and DDR4 declines spread, buyer inventory above 9 weeks | Q1 2027 contract prices flat or down |
| D. LTA floors fail and capex is cut, below ₩144,000 | Hyperscalers cut 2027 capex guidance | Reports of floor renegotiation |
The calendar that decides it
| Event | When | Baseline | Upside call | Downside call |
|---|---|---|---|---|
| Q4 preliminary results | Early Jan 2027 | OP ₩116.3T (consensus, secondhand) | ₩120T+ despite FX headwind | Below ₩110T |
| Late-January board meeting | Late Jan 2027 | ₩30T+ cancelled out of ₩55-75T remaining | Comes with LTA coverage and HBM4 pricing disclosure | Cancellation below ₩30T, preferred share weight 12% or less |
| Q1 2027 commodity DRAM contract prices | Late Dec 2026 to Jan 2027 | +5-10% (author estimate) | Keep rising | Flat or down |
| Buyer inventory | Quarterly 10-Qs, TrendForce | 2-9 weeks above normal | Shrinking | Above 9 weeks |
| Hyperscaler 2027 capex | Late Jan to Feb 2027 results | Still growing | Growth accelerates | Cuts |
| November 2 close | Nov 2, 2026 | Reflects the US chip selloff | Holds above ₩207,000, foreign net buying | Breaks the Oct 15 low |
A 6-7% payout and ₩9,000 of book value per quarter support the floor
The 2026 shareholder return plan of ₩90-110 trillion is ₩13,400-16,300 per share, a 6.1-7.4% yield at today’s price. The January board meeting sets the 2027 policy. We covered the board timing and buyback calendar in our shareholder return analysis.
As shown above, book value grows by about ₩9,000 per quarter. Even if the stock stays flat, price to book falls every quarter. The longer the decline lasts, the closer the 1x-book floor comes to the stock price.
SK hynix and Micron watch the same contract price
SK hynix has a larger HBM share, so under the same drop assumption its PER is lower (3.4x 2027). Micron’s fiscal year differs, which makes a direct comparison hard. For all three, commodity DRAM contract prices drive 2026-27 profits. So the direction of Q1 2027 contract prices is the shared deciding variable. We covered fair multiples on normalized earnings in Samsung at 5-7x, SK hynix at 6-8x, and buyer inventory in part of the DRAM shortage is buyer inventory.
Limits of this math
- The past-cycle bottom multiples (Jan 2019 ~6.1x and 1.0x book, Sep 2022 ~6.4x and 1.0x book, Nov 2017 8x 2018E, Jan 2021 17x 2021E) and the 9-15 month lead of the stock over the profit peak are the author’s approximations. We did not recheck them against primary data.
- The 2027 EPS of about ₩72,000 is backed out from FnGuide’s 2027 PER. Naver Finance does not publish 2027 estimates.
- The BPS estimates are rough. They simplify translation gains and losses, buyback dilution, and the 2027 dividend policy.
- Prices are October 30 closes. Korea trades the October 30 US chip selloff on November 2.
Which way do you think Q1 2027 commodity DRAM contract prices will go? Pick one of still rising, flat, or falling, and tell us why.
This is for research and information only, not investment advice. Estimates and scenarios are analytical assumptions, not trading instructions or individual portfolio decisions. Figures are dated data, and consensus and some reported figures are secondary compilations. We used Anthropic’s Claude for research and editing. Anthropic appears in the AI memory demand chain discussed here as a compute buyer.