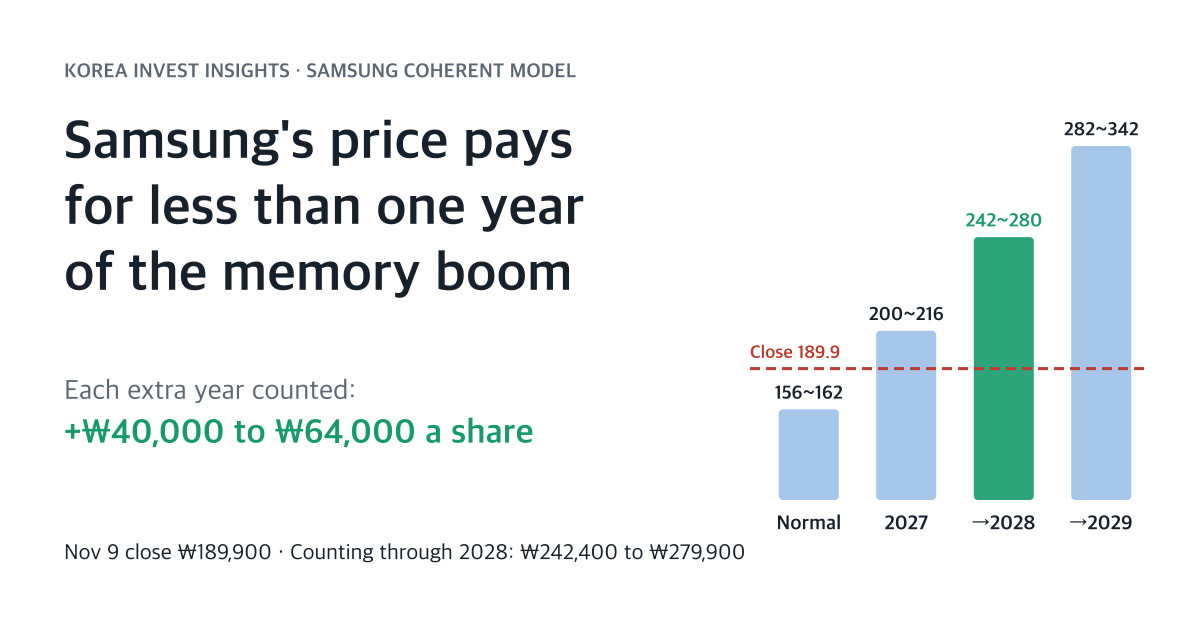
Samsung Electronics closed at ₩189,900 on November 9. We rebuilt our valuation model of Samsung from the ground up and asked it one question: how many years of boom profit does that price pay for?
The answer is less than one. In our model, a share is worth ₩155,600 to ₩162,000 if memory profit went back to a normal year in 2027. Counting 2027’s boom profit lifts the value to ₩200,200 to ₩215,800. Today’s price sits between the two. It pays for 52% to 77% of 2027’s excess profit and for nothing after that.
Each further year you are willing to count adds ₩40,000 to ₩64,000 a share. Count through 2028 and the value is ₩242,400 to ₩279,900, 28% to 47% above the close.
On November 8 we wrote that Samsung’s price only works if three bear cases hit at once. The rebuilt model gives a simpler reading. One assumption is enough: the boom ends after 2027.
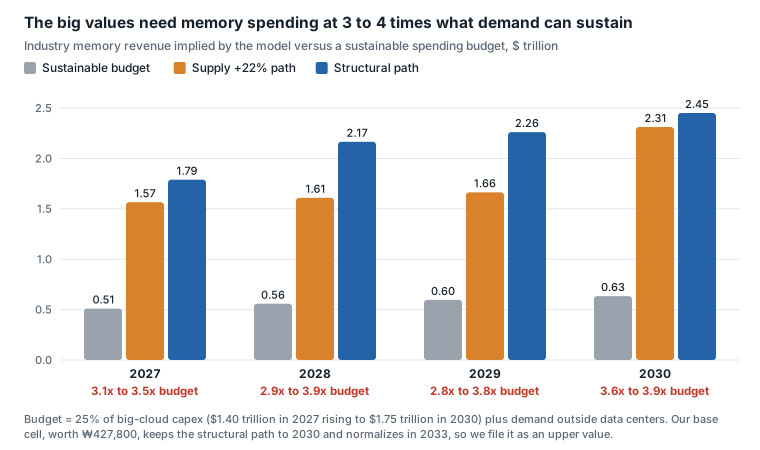
Our view: we count 2028, and we stop there. The inventory ledger is the reason. Even if the industry adds 22% more DRAM bits in 2027, as brokers expect, supplier inventory in our model only rises to 7.6 weeks by the end of 2028, still below a normal 9 weeks. We do not count 2029 and later, because those inputs have no source and they would need memory spending at three to four times what demand can sustain. Our working range of ₩233,000 to ₩291,000 does not change. These numbers are provisional; data due in December will reset them.
- Samsung’s value is a staircase. The floor is a normal year, worth ₩155,600 to ₩162,000. Each step is one more year of boom profit, worth ₩40,000 to ₩64,000.
- The market stands partway up the first step. Under harsh capital assumptions it reaches the second step. It never reaches the third.
- 2027 profit splits on one input: how much DRAM the industry adds. Our bottom-up build gives +10.7% and ₩724.7 trillion of operating profit. The sell-side +22% gives ₩616.9 trillion, next to the ₩606.6 trillion consensus.
- 2028 profit holds in our model even at +22% supply (₩621.2 trillion), because inventory never gets back to normal. The model cannot draw a crash, though, and that is its largest blind spot.
- Micron’s supply view in mid-December comes first. The first data that can tell the two supply paths apart is TrendForce’s second-quarter 2027 contract-price outlook in late March.
Samsung’s value is a staircase
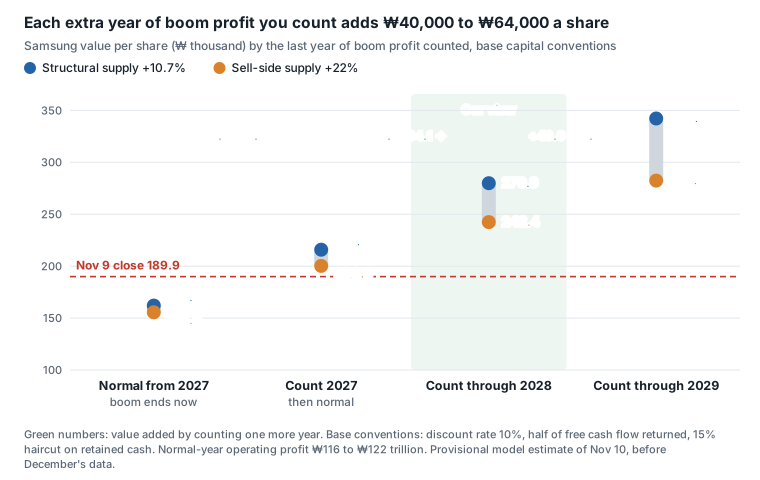
Picture Samsung’s value as a staircase. The ground floor is what Samsung would be worth if memory went back to a normal year right away. Each step up is one more year of boom profit that you believe in.
The ground floor is low. In our normal year, Samsung’s operating profit settles at ₩116 trillion to ₩122 trillion, against about ₩387 trillion estimated for 2026. Across our range of normal-year assumptions, conventional DRAM prices fall to about 0.3 times their third-quarter 2026 level. That floor is worth ₩155,600 to ₩162,000 a share, below today’s price.
The steps are large. Counting 2027 adds ₩44,600 to ₩53,800. Counting 2028 adds another ₩42,200 to ₩64,100. Counting 2029 adds ₩40,000 to ₩62,300. The two ends of each bar are the two supply paths we explain below.
Now read the price against the staircase. ₩189,900 is above the floor and below the first step. On the sell-side supply path it pays for 77% of 2027’s excess profit. On our structural path it pays for 52%. Put another way, to justify today’s price while counting 2027 to 2029, Samsung’s operating profit would have to settle at ₩200 trillion to ₩254 trillion a year. That is 52% to 66% of this year’s estimated profit.
How we built the model
Our earlier Samsung work came from four families of models. They came closest on 2027 and split on most other things. When we lined them up, much of the disagreement had nothing to do with the future. The models used different share counts (6.519, 6.521 and 6.649 billion), different exchange rates (₩1,340, ₩1,364 and ₩1,417 per dollar), different tax rates, different discount timing and different treatment of cash.
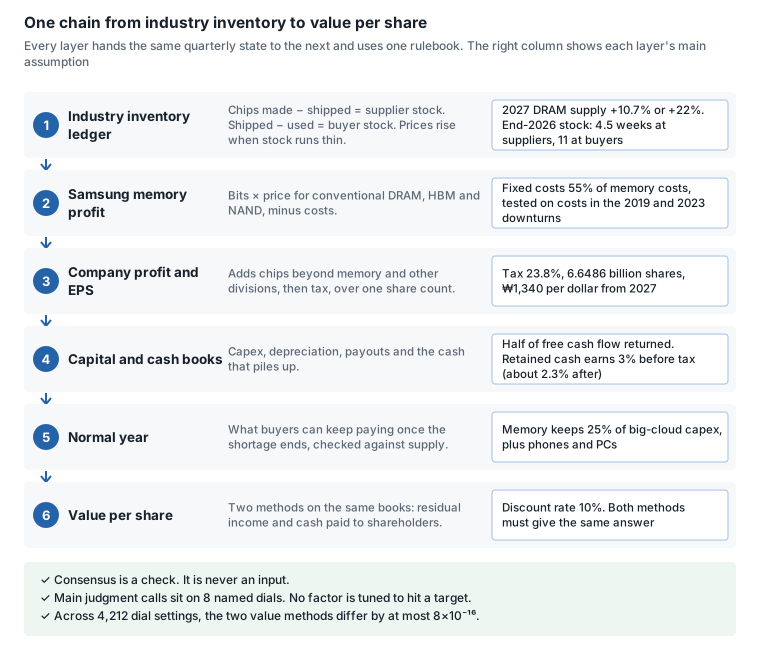
So we rebuilt the work as one chain with one rulebook. Six layers pass the same quarterly state down the line.
- Industry inventory ledger. Every quarter, chips made minus chips shipped is the change in supplier inventory, and chips shipped minus chips used is the change in buyer inventory. Prices rise when inventory runs thin and fall when it piles up. This layer turns supply and demand into a price path.
- Samsung memory profit. Bits times price for conventional DRAM, HBM and NAND, minus costs. Fixed costs are 55% of memory costs, a share that reproduces how Samsung’s costs moved in the 2019 and 2023 downturns.
- Company profit and EPS. The model adds the rest of Samsung, takes tax at 23.8% and divides by one share count, 6.6486 billion.
- Capital and cash books. Capex, depreciation, payouts and cash. Half of free cash flow goes back to shareholders. The rest piles up and earns 3% before tax, about 2.3% after tax.
- Normal year. What buyers can keep paying once the shortage ends. We assume memory can keep 25% of big-cloud capex, plus demand from phones and PCs, and we check that budget against what the industry can supply.
- Value per share. The model computes value two ways on the same books: residual income (book value plus profit above the cost of capital) and the cash paid to shareholders.
Rules keep the chain honest. Consensus is a check, never an input, so we do not tune the model to land on brokers’ numbers. The main judgment calls sit on eight named dials, such as 2027 supply or how long boom profit lasts, so the same judgment cannot enter twice. Other assumptions, such as starting inventory, are stated and tested one at a time; there is no calibration factor. And the two value methods must agree. Across 4,212 dial settings, the largest gap between them was 8×10⁻¹⁶, a rounding error.
We also tested the chain against outside benchmarks. It reproduces the memory profit of our older engines within 0.4%. It runs against Samsung’s reported quarters since 2022. And a second AI model from another vendor reran the code on its own and reproduced nine headline numbers. That review raised five issues. We fixed three, recorded one as a weakness and withdrew one conclusion that our formulas did not support.
The first fork: how much DRAM the industry adds in 2027
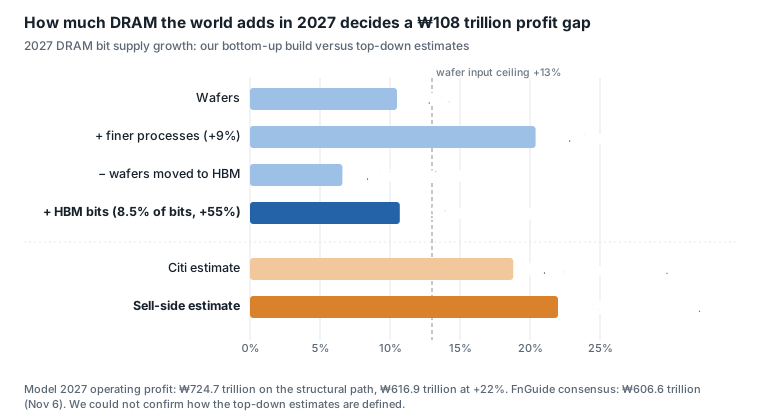
2027 profit turns on one number: how many more DRAM bits the industry ships. Brokers use about +22%, and Citi uses +18.8%. We built the number from the bottom up.
Wafer capacity grows about 10.5% in 2027, and finer processes add about 9% more bits per wafer. Together that is +20.4% before HBM. HBM, the stacked memory inside AI accelerators, takes a growing share of those wafers. After the move, conventional DRAM supply grows only 6.6%. Adding HBM’s own bits (8.5% of the total, up 55%) gives +10.7% for the industry.
To reach +22%, wafers would have to grow 19.7%. To reach +18.8%, they would have to grow 17.1%. The top of our wafer input range is 13%. The top-down figures sit close to our number before HBM takes its wafers, but we could not confirm how they are defined. We note the match and do not draw a conclusion from it. Micron’s guidance in mid-December should settle the question.
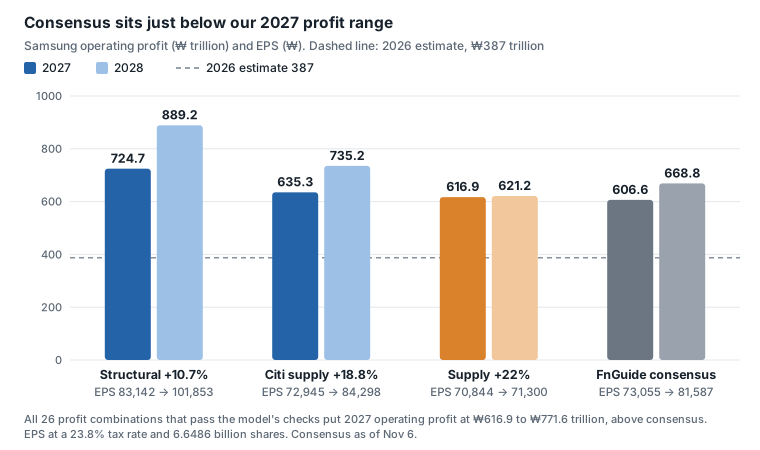
The two supply paths give very different years. On the structural path, 2027 operating profit is ₩724.7 trillion and EPS is ₩83,142. At +22% it is ₩616.9 trillion and ₩70,844, close to the FnGuide consensus of ₩606.6 trillion and ₩73,055. All 26 profit combinations that pass the model’s checks put 2027 at ₩616.9 trillion or more. Consensus sits just below the bottom of our range.
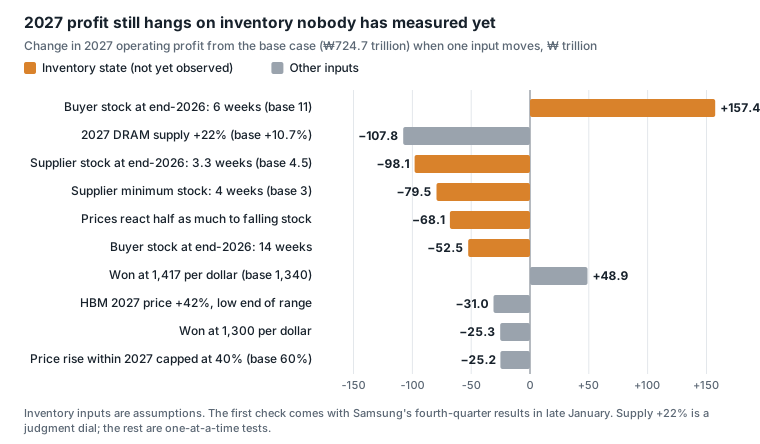
2027 is less settled than it looks. Fourth-quarter exit prices do carry into next year. The inventory that Samsung’s customers will hold at the end of this year, however, has not been measured. If buyers hold 6 weeks instead of our assumed 11, 2027 profit rises by ₩157 trillion. If suppliers hold 3.3 weeks instead of 4.5, it falls by ₩98 trillion. These swings are as large as the supply question.
Why we count 2028: inventory never gets back to normal
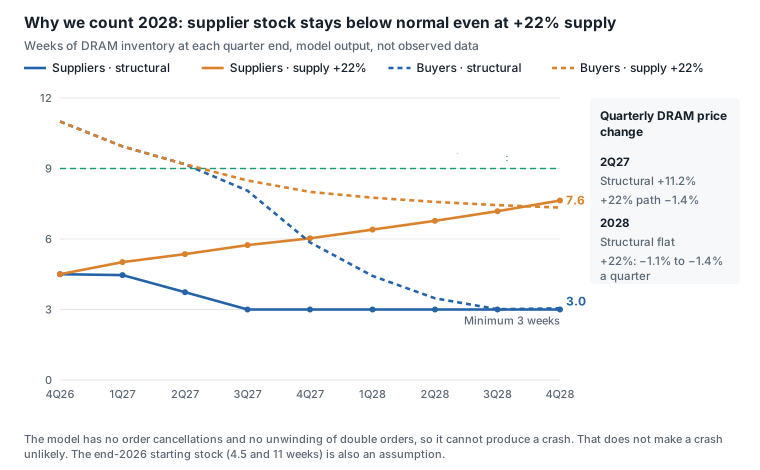
The market prices 2028 as the year the boom ends. Our inventory ledger disagrees, even with the brokers’ supply number.
On the structural path, 2027 drains both sides. Supplier inventory falls to the 3-week floor by the third quarter, and buyer inventory falls from 11 weeks to about 6 by the end of 2027. In 2028, conventional DRAM supply grows 13.5% and demand grows 12.9%, so prices hold flat.
On the +22% path, supplier inventory does build, from 4.5 weeks at the end of 2026 to 7.6 weeks at the end of 2028. It still does not reach the 9 weeks we treat as normal. Prices slip only 1.1% to 1.4% a quarter, and 2028 operating profit stays at ₩621.2 trillion, about where 2027 was.
This is why we side with counting 2028. The model says the profit survives, and the price says it does not. That gap is worth ₩42,000 to ₩64,000 a share.
The evidence against this view deserves space. First, spot prices and lead times have started to soften. TrendForce’s module table showed the spot price of a 32GB DDR5 server module down 6.5% in the week of November 2. That is one week of data, and it mostly reflects a shrinking module premium while chip spot prices sit near their highs. TrendForce’s AI server parts tracker put DRAM lead times at 18 weeks on November 9, down from 20 two weeks earlier, as Chinese cloud firms cut high-capacity orders and U.S. demand stayed firm. Contract prices are still rising. Second, the model has no order cancellations and no unwinding of double orders, so it cannot draw a crash. The absence of a crash in the model says nothing about the odds of one. Third, the 2019 and 2023 downturns both came with only three major suppliers in the market, so a concentrated industry gives no protection on its own.
We also share new analyses on Telegram as they are published. You are welcome to join us at @korea_invest_insights.
What ₩189,900 is really saying
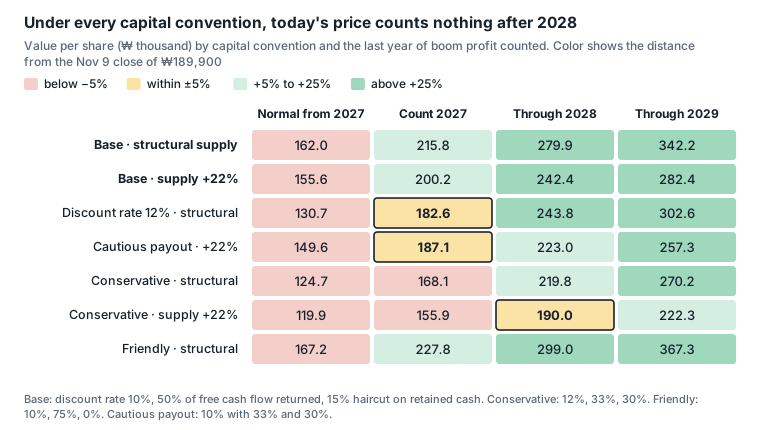
The staircase depends on capital assumptions: the discount rate, how much cash Samsung returns and how much we discount the cash it keeps. So we redrew it under several sets.
Under our base set (a 10% discount rate, half of free cash flow returned and a 15% haircut on retained cash), the price pays for less than one year. With a 12% discount rate, it pays for about one year. Under a conservative set (12%, a third returned and a 30% haircut) on the +22% supply path, it pays for two years: counting through 2028 gives ₩190,000.
So the price reads two ways: about one year of boom on normal assumptions, or two years on harsh ones. The two readings share one feature. No row gives any value to boom profit in 2029 or later. Every “through 2029” cell is at least 17% above the price.
How much cash Samsung returns matters for this reading. We covered that link in Samsung’s two engines. The board’s return policy in January gives the first answer.
Why we do not treat the big numbers as proof
Our full grid of 4,212 dial settings gives ₩198,900 to ₩834,900 a share, and no setting falls below today’s price. That sounds like a strong signal. We do not use it as one.
The reason is how the grid is built. Its shortest setting for the life of boom profit still counts every year through 2029, so the whole grid starts above the price by construction. The question the price asks lives below the grid, which is why we built the staircase separately.
The grid’s base cell, worth ₩427,800, is an upper value in our reading, and we do not use it as a center. To get there, industry memory revenue would stay at 3.5 to 3.9 times a sustainable budget every year through 2030 before normalizing in 2033. The 2029 and 2030 inputs behind it have no source. By 2033 Samsung would also hold ₩2,047 trillion of retained cash, so much of that value depends on a 50% payout lasting seven years.
What moves the value
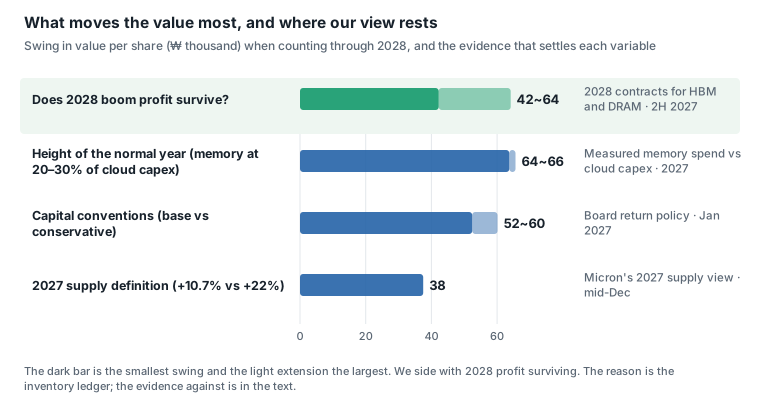
| Variable | Swing per share | Where things stand | What would flip it | When |
|---|---|---|---|---|
| Does 2028 boom profit survive? | ₩42,000 to ₩64,000 | The model says yes. The price says no. | 2028 contract prices for HBM and DRAM, buyers cancelling orders, supplier inventory above 5 weeks and rising | 2H 2027; inventory from late January 2027 |
| How high is the normal year? | ₩64,000 to ₩66,000 | We assume memory keeps 25% of cloud capex (range 20% to 30%) | Measured memory spending against cloud capex, contract prices in 2H 2027 | 2027 |
| Capital conventions | ₩52,000 to ₩60,000 | Open | The payout ratio and buyback share in the board’s return policy | January 2027 |
| 2027 supply definition | ₩38,000 | Open. Consensus sits at +22% | Micron’s view of 2027 industry DRAM bit supply | Mid-December 2026 |
Our view rests on the first row. We side with 2028 profit surviving because of the inventory ledger, and we listed the evidence against it above. The second row is as large, and nobody can observe it before 2027. The supply definition has the smallest swing, but it is the first to get an answer.
Where the model is weak
| Weakness | Where it shows | Size | Next fix |
|---|---|---|---|
| No order cancellations or double-order unwinding | The model cannot draw a 2028 crash | Not measured | Add buyer cancellations to the inventory ledger |
| No demand-budget check for 2027 to 2030 | Base-path revenue at 3.5 to 3.9 times the sustainable budget | Upper values inflated | Make yearly budget use a gate |
| Prices react more to inventory changes than to levels | 2027 profit moves with starting inventory | ±₩50 trillion to ₩100 trillion in 2027 | Add a level term, reset starting stock in late January |
| The 2029 cleanroom wave is missing | Conventional supply grows only 8.0% in 2029 and 3.8% in 2030 | The whole path after 2029 | Feed the cleanroom schedule into the ledger |
| Weak tax fit to history | Past effective tax median 11.1% against our 23.8% | Fits 2026-level profit only | Fix tax and share rules from the third-quarter report |
| NAND path | NAND prices fall to 0.25 times the 2026 average by 2030 | NAND revenue falls from ₩177 trillion to ₩66 trillion | Review supply-cut response |
The missing cleanroom wave matters most for the years we do not count. We described that wave in the DRAM glut post.
What we watch next
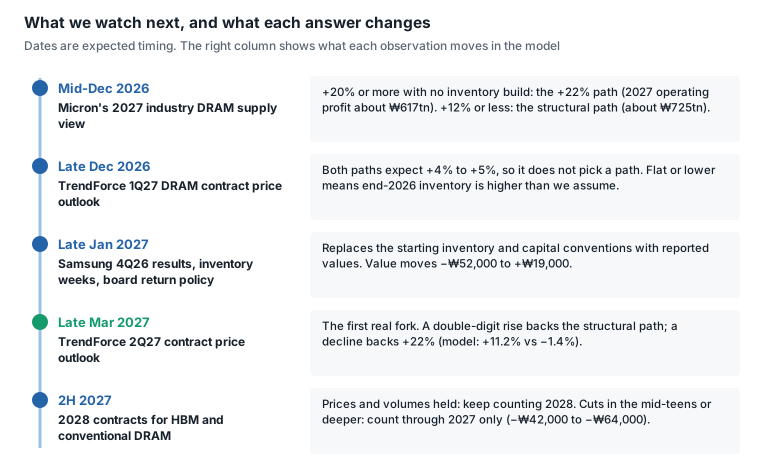
These checkpoints mark where we will look at the view again. They are not automatic trading rules.
Data notes
- We collected no new external data for this post. Figures come from our model run of November 10 and our dated model files and analysis notes.
- The share price is the KRX close on November 9. Consensus is FnGuide as of November 6. We did not refresh either for this post.
- All values are provisional and come before Micron’s December guidance and TrendForce’s late-December outlook. We will rerun the same input file when the data arrives.
- Grid cell counts and ranges are not probabilities. We did not weight scenarios.
- End-2026 inventory weeks, price-response coefficients and buyers’ target inventory are assumptions. Together they move 2027 profit by ±₩50 trillion to ₩150 trillion.
- EPS uses a 23.8% tax rate. With the 20.3% rate implied by consensus, the structural path gives ₩86,961 for 2027 and ₩106,532 for 2028.
- Exchange rates are ₩1,337.4 per dollar for the fourth quarter of 2026 (actual through October 30) and ₩1,340 from 2027.
- Spot and lead-time figures come from TrendForce tables as of November 2 and November 9.
- The second-model review checked calculations and formulas. It did not re-verify the facts or freshness of the original sources.
How many years of Samsung’s memory boom would you pay for today? Reply with A, B, C or D, and the one number that decides it for you.
A. Less than one. The price is right, and the boom fades during 2027.
B. One. Count 2027, then a normal year.
C. Two. Inventory stays thin through 2028.
D. Three or more. HBM contracts carry excess profit past 2029.
This is for research and information only, not investment advice. Value ranges are analytical assumptions, not trading instructions or individual portfolio decisions. Figures are dated data. We built and ran the model with Anthropic’s Claude, and an OpenAI GPT model reviewed the calculations without making judgments. Samsung’s memory demand depends on AI capital spending, and both companies belong to the industry on the buying side. We did not assess the size of that effect.