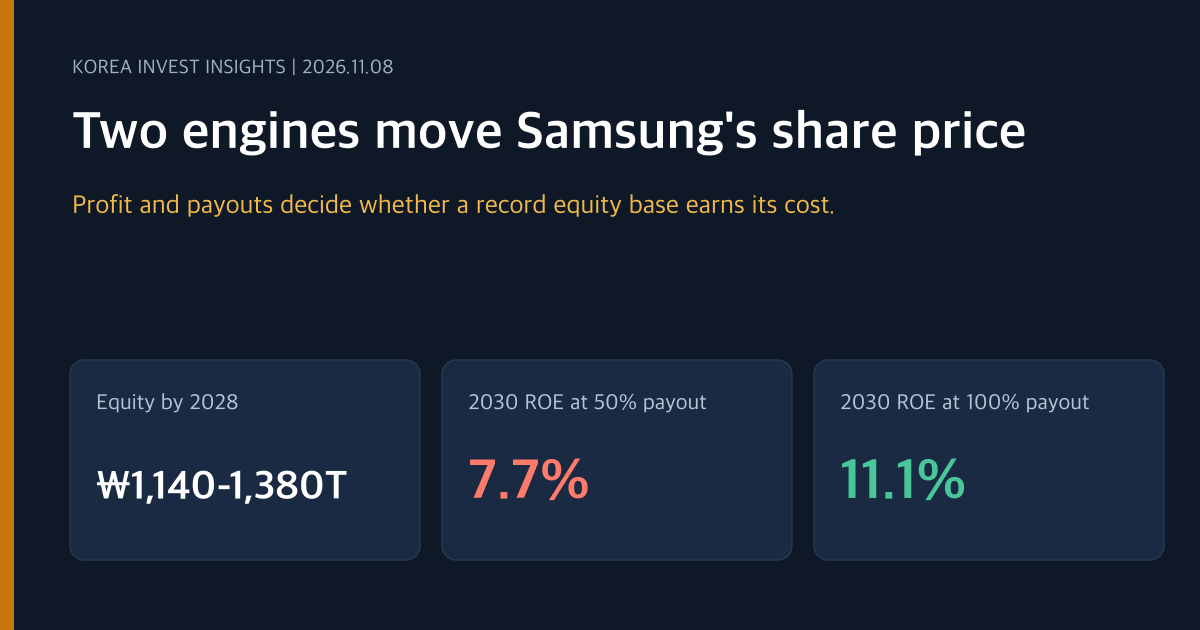
Samsung Electronics is worth ₩1,230 trillion at the ₩188,700 close on November 6. On our base path, with half of free cash flow paid out, equity attributable to owners builds to ₩1,140 trillion by the end of 2028. That is about $840 billion, more than Berkshire Hathaway’s $747.9 billion, the largest equity base we found among listed companies.
A big equity base does not buy a big market value. Four of the eight largest equity bases belong to China’s big four banks. Their equity of $463.6 billion to $647.0 billion is larger than Samsung’s current $442.5 billion. Their market values, $331 billion to $467 billion, are roughly a third to a half of Samsung’s $907 billion, and they trade at 0.56 to 0.82 times book value.
Two engines decide where Samsung’s stock goes. The business engine sets how much the company earns. The payout engine sets how much of that profit stays inside the company. Together they set return on equity (ROE), and whether ROE clears investors’ 10% required return sets the multiple the market pays. The market decides the first engine. The company decides the second, and its first answer comes at the board meeting in late January.
- Market value is equity times price-to-book (P/B), and P/B depends on how far ROE sits above the 10% required return.
- On the base path net income falls from ₩448 trillion in 2027 to ₩90 trillion in 2030 (plus interest on retained cash) while equity grows from ₩914 trillion to ₩1,357 trillion, so ROE drops from 56% to 7.7%.
- About ₩650 trillion of the 2030 equity is retained cash earning roughly 3% after tax. That cash drags ROE below the required return.
- Raising the payout from 50% to 100% of free cash flow leaves 2030 equity at ₩847 trillion and lifts ROE to 11.1%, above 10%. The payout rate is the one big variable the company sets directly.
- Payouts do not create value. In our model, value rises only about ₩10,000 per share when the payout goes from 50% to 100%. What changes a lot is the frame the market uses to price the stock.
The Largest Equity in the World Does Not Buy the Largest Multiple
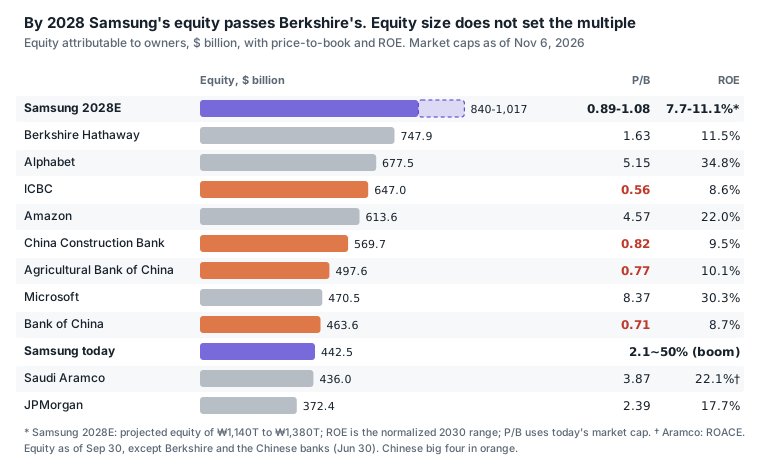
The bars show equity. The two right-hand columns show the multiple the market paid for that equity and the return the equity earns. Bar length and P/B follow no rule. The multiple follows ROE. China’s big four banks earn 8.6% to 10.1% and trade at 0.56 to 0.82 times book. Berkshire earns 11.5% and trades at 1.63 times. Alphabet, Amazon and Microsoft earn 22% to 35% and trade at 4.6 to 8.4 times.
Samsung sits between the Chinese banks and Berkshire. If normalized ROE lands at 7.7% to 11.1%, the market multiple for similar returns is about one times book. Today, in a boom year, Samsung’s ROE is about 50%, yet it trades at 2.1 times book (on equity reported at September 30), below Alphabet’s 5.15 times at a 34.8% ROE.
The Stock Price Is a Chain: Profit, Equity, Multiple
Think of a bathtub. Profit is the tap, payouts are the drain and equity is the water level. Investors do not pay for how high the water stands. They pay for how hard that water works. Unrolled, the chain reads like this.
- ROE = net income ÷ equity
- P/B = (ROE − growth) ÷ (required return − growth). With growth set to 0 and a 10% required return, as in our model, P/B = ROE ÷ 10%.
- Market value = equity × P/B
When ROE equals the required return, P/B is 1. Put in ₩1, earn 10%, and investors ask for 10%: that ₩1 is worth exactly ₩1. If ROE is lower, the ₩1 is priced below ₩1. If it is higher, the ₩1 is priced at several won. China’s big banks are the first case. Alphabet and Microsoft are the second.
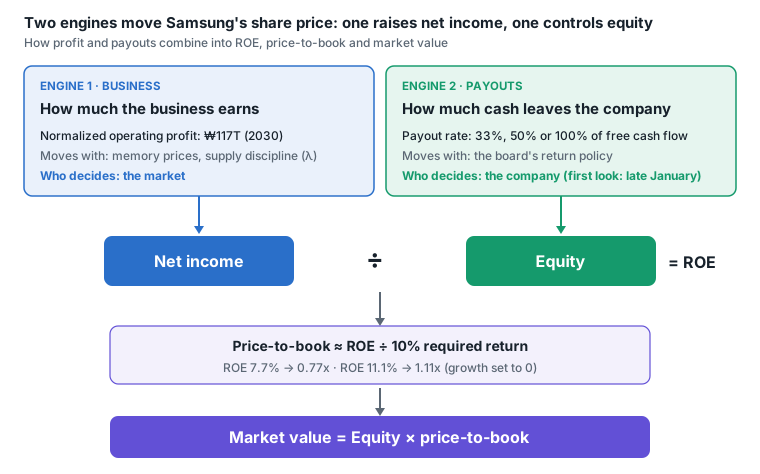
The business engine moves the numerator. After the 2027 to 2029 boom, normalized operating profit settles near ₩117 trillion (2030). Memory prices and supply discipline set that level. The market sets it, not the company.
The payout engine moves the denominator. Cash paid out does not pile up as equity. The payout rate is the variable the company sets directly.
The Boom Piles Up Equity, and ROE Falls With It
On the base path, the 2027 to 2029 boom profits pile up as equity. After normalization, operating profit returns to ₩117 trillion. The numerator shrinks while the denominator grows. This is the result with the current 50% payout policy kept in place.
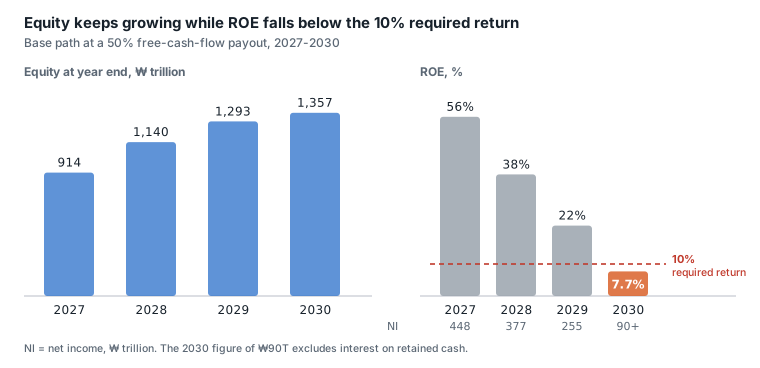
The 2030 ROE of 7.7% sits below the 10% required return. The equity base is among the largest in the world, and it earns less than its cost.
Nearly Half of That Equity Is Cash Earning About 3%
Of the ₩1,357 trillion of equity in 2030, about ₩650 trillion is retained cash that the business does not use. That cash earns roughly 3% after tax. The capital that does work in the business earns far more (about 17% ROIC in the model).
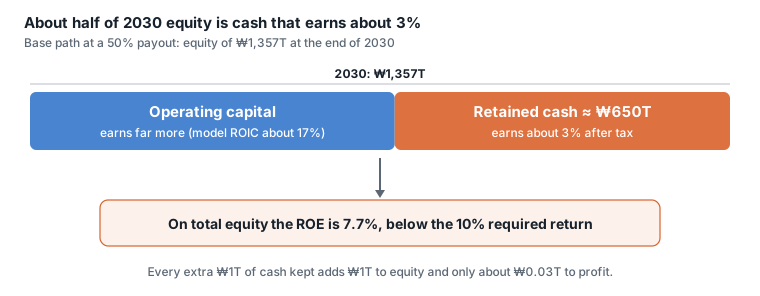
Put on total book equity, the mix pulls ROE down to 7.7%. Every extra ₩1 trillion of retained cash earns only 3% while it enlarges the denominator. Left alone, the largest equity base turns into capital that does not earn its cost.
We also share new analyses on Telegram as they are published. You are welcome to join us at @korea_invest_insights.
The Payout Engine Is the One Big Variable the Company Sets Itself
Cash paid out does not pile up as equity. Here is the 2030 result when only the payout rate changes and the operating profit path stays the same.
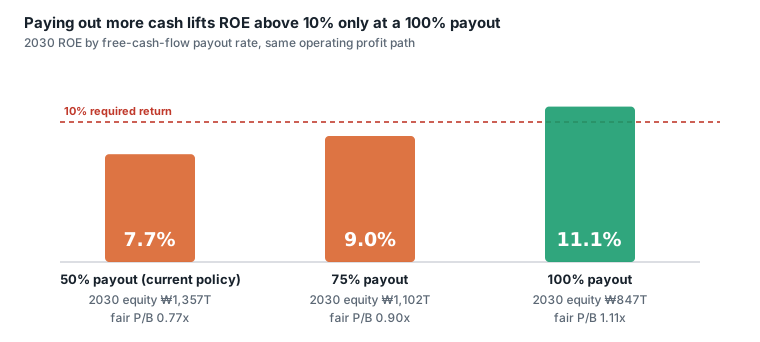
At a 100% payout equity stops at ₩847 trillion, ROE reaches 11.1% above the required return, and P/B sits above 1. At 50%, equity is ₩1,357 trillion, ROE is 7.7% and P/B sits below 1. That is how a smaller equity base can carry a higher multiple. It is also why today’s ₩1,230 trillion market value is about one times 2028 equity. The market prices Samsung as a company with a large equity base that earns about its cost of capital.
Equity at the end of 2028 depends on the payout rate and the profit path.
| Equity attributable to owners, end of 2028, ₩ trillion | 33% payout | 50% payout | 100% payout |
|---|---|---|---|
| Lower profit path (independent anchor model) | 1,236 | 1,126 | 803 |
| Base profit path (sustainable price-and-volume model) | 1,255 | 1,140 | 803 |
| Broker consensus, FY27-28 | 1,360 | 1,219 | 803 |
| Higher profit path (cash-flow model) | 1,380 | 1,234 | 803 |
The claim that equity is at least ₩1,200 trillion even on conservative numbers comes with conditions. At a 50% payout only the consensus path and above clear ₩1,200 trillion, and our base path gives ₩1,140 trillion. At a 33% payout every path is ₩1,236 trillion or more. At a 100% payout every path ends at ₩803 trillion, below Berkshire. Today’s ₩1,230 trillion market value is about 0.9 to 1.1 times 2028 equity.
The 2024 to 2026 return policy (50% of free cash flow) ends in 2026. The late-January board meeting sets the policy from 2027. Cash arriving in 2027 to 2029 comes to about ₩960 trillion of free cash flow. That one decision places 2030 equity somewhere between ₩847 trillion and ₩1,357 trillion, and 2030 ROE somewhere between 7.7% and 11.1%.
The Business Engine Has the Higher Ceiling, but the Company Does Not Set It
There are only two ways to raise ROE: shrink the denominator or grow the numerator. Payouts shrink the denominator. Higher profit and reinvestment of retained cash grow the numerator.
| Lever | How it works | 2030 ROE effect (base path) | Certainty |
|---|---|---|---|
| ① Payouts (smaller denominator) | Cash goes back, so equity does not pile up | 50% to 100% payout: 7.7% to 11.1% | High. The company decides |
| ② Higher profit (bigger numerator) | Price discipline (λ), share, bit growth | λ 0.5 to 1: normalized operating profit ₩117 trillion to ₩129 trillion, ROE about +0.7 points. Larger if the 2029 to 2033 profit path is higher | Low. The market decides |
| ③ Reinvest retained cash (bigger numerator) | Put 3% cash into a business earning 17% ROIC | All ₩650 trillion at 17%: ROE of 14% or more in theory | Lowest. No obvious projects, poor track record |
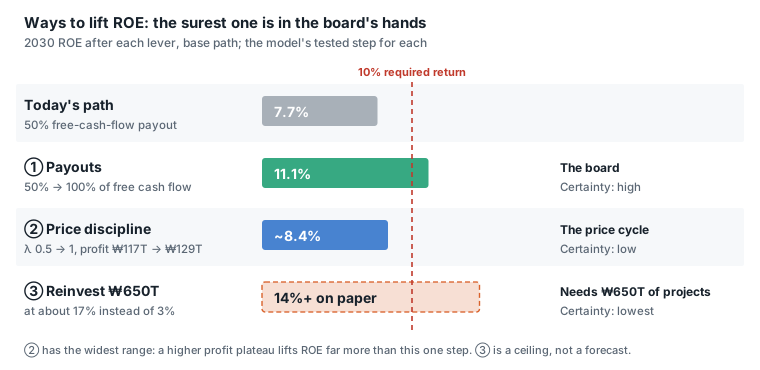
Profit (②) is set by the market. The one step our model tested, λ from 0.5 to 1, lifts normalized operating profit from ₩117 trillion to ₩129 trillion and ROE by about 0.7 points. On a path where the profit level itself is higher, the effect is much larger. If operating profit doubled, ROE would rise far more than any payout change. But the price cycle sets that variable.
Reinvestment (③) works only if there are places to put ₩650 trillion at 17%. Memory capex already runs at ₩120 trillion a year, and more than that creates oversupply that cuts prices and hurts ②. Foundry and acquisitions have earned low returns in the past. So ③ is more likely to burn capital than to grow the numerator. That is why our model puts a 15% loss rate on retained cash (the windfall loss rate).
Payouts are not the biggest way to lift ROE. The profit level can be the biggest lever, but Samsung does not set it, and reinvestment is large on paper but likely to fail. What remains is the payout. The accurate claim is narrower: payouts are the only reliable method the company can choose by itself.
The Same Equity Is Worth ₩103,000 or ₩300,000 a Share, Depending on the Multiple
Assume 2028 equity of ₩1,200 trillion and change only the multiple.
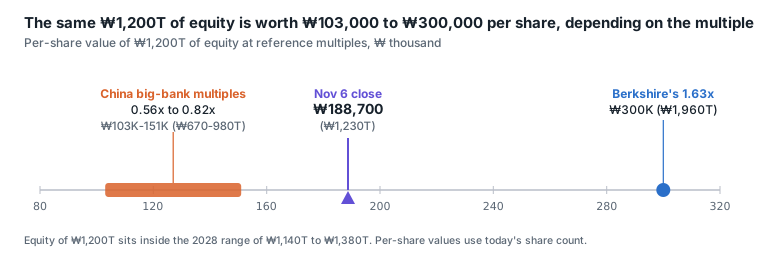
China’s big-bank multiples of 0.56 to 0.82 give ₩670 trillion to ₩980 trillion (₩103,000 to ₩151,000 a share). Berkshire’s 1.63 gives ₩1,960 trillion (₩300,000 a share). The November 6 close of ₩188,700 sits in between. Samsung’s normalized ROE range of 7.7% to 11.1% runs from the Chinese banks (8.6% to 10.1%) up to just below Berkshire (11.5%).
Equity above ₩1,200 trillion is not a reason for the market value to rise. It is a risk that ROE gets diluted. The payout rate and the return on retained cash decide whether that risk grows or shrinks.
Payouts Do Not Create Value; They Change How the Market Prices It
A payout returns ₩1 as ₩1. In our model, value per share rises only about ₩10,000 when the payout goes from 50% to 100%, because the model counts retained cash at 85% of face value. What changes a lot is accounting ROE and P/B, that is, the frame the market prices the stock in, and the risk that cash leaks into low-return investment. At the same value, a company that looks like it earns below its cost of capital trades differently from one that looks like it earns above. That is the gap between the Chinese banks and Berkshire.
Payouts have more limits. A buyback raises value per share only when the price is below value. ₩188,700 is below our model’s value of ₩276,000, so repurchases help now. Buying above value would hurt. A dividend has no such problem, but it is taxed.
There is also a ceiling. At a 100% payout ROE is 11.1%, only one point above the required return. To go beyond that, normalized profit itself must grow.
What the Late-January Board Can Show, and What It Cannot
The best case uses both engines. Supply discipline keeps λ up and supports the numerator. Cash that is still left over goes back and pins the denominator. The late-January board can set the payout rate and the size of capex. It cannot set memory prices. So the January announcement is the first look at how fast the company’s own engine is running.
Data Notes
- We collected no new external data for this post. Figures come from our model files and the analysis note of November 8.
- The share price and market values are as of November 6. The 1.17 times book value in our earlier post used 12-month-forward equity. The current P/B of 2.1 in this post uses equity reported at September 30. On projected end-2028 equity, P/B is about 0.9 to 1.1.
- For global equity, US company values were rechecked directly in SEC XBRL data. The Chinese banks and Aramco come from filed reports. Berkshire and the Chinese banks have no September 30 report yet, so their June 30 values are used. All values are converted at the November 6 exchange rate, and reporting dates differ from pricing dates.
- Aramco’s ROE slot shows ROACE (return on average capital employed). Samsung’s boom-year ROE of about 50% is an approximation.
- Fair P/B is simplified to 0% growth and a 10% required return. ROE effects are measured inside our model and depend on its settings.
- The 2030 net income of ₩90 trillion has interest on retained cash added to it. ROIC divides by operating invested capital and ROE divides by book equity, so a simple weighted average of the 17% ROIC and the 3% cash return does not give 7.7%.
- Profit paths and payout rates are assumptions. The payout rate is set by the board and has not been announced.
If you sat on Samsung’s board in January, would you vote for a 50% or a 100% payout? Reply with the one number that decides it for you.
This is for research and information only, not investment advice. Value ranges and scenarios are analytical assumptions, not trading instructions or individual portfolio decisions. Figures are dated data. We built the profit model with AI and used AI for research and editing, working with Anthropic’s Claude and OpenAI GPT models. The comparison table includes Alphabet and Amazon, investors in Anthropic, and Microsoft, an investor in OpenAI. This post does not assess those companies’ businesses or value. It compares only their equity and ROE figures.