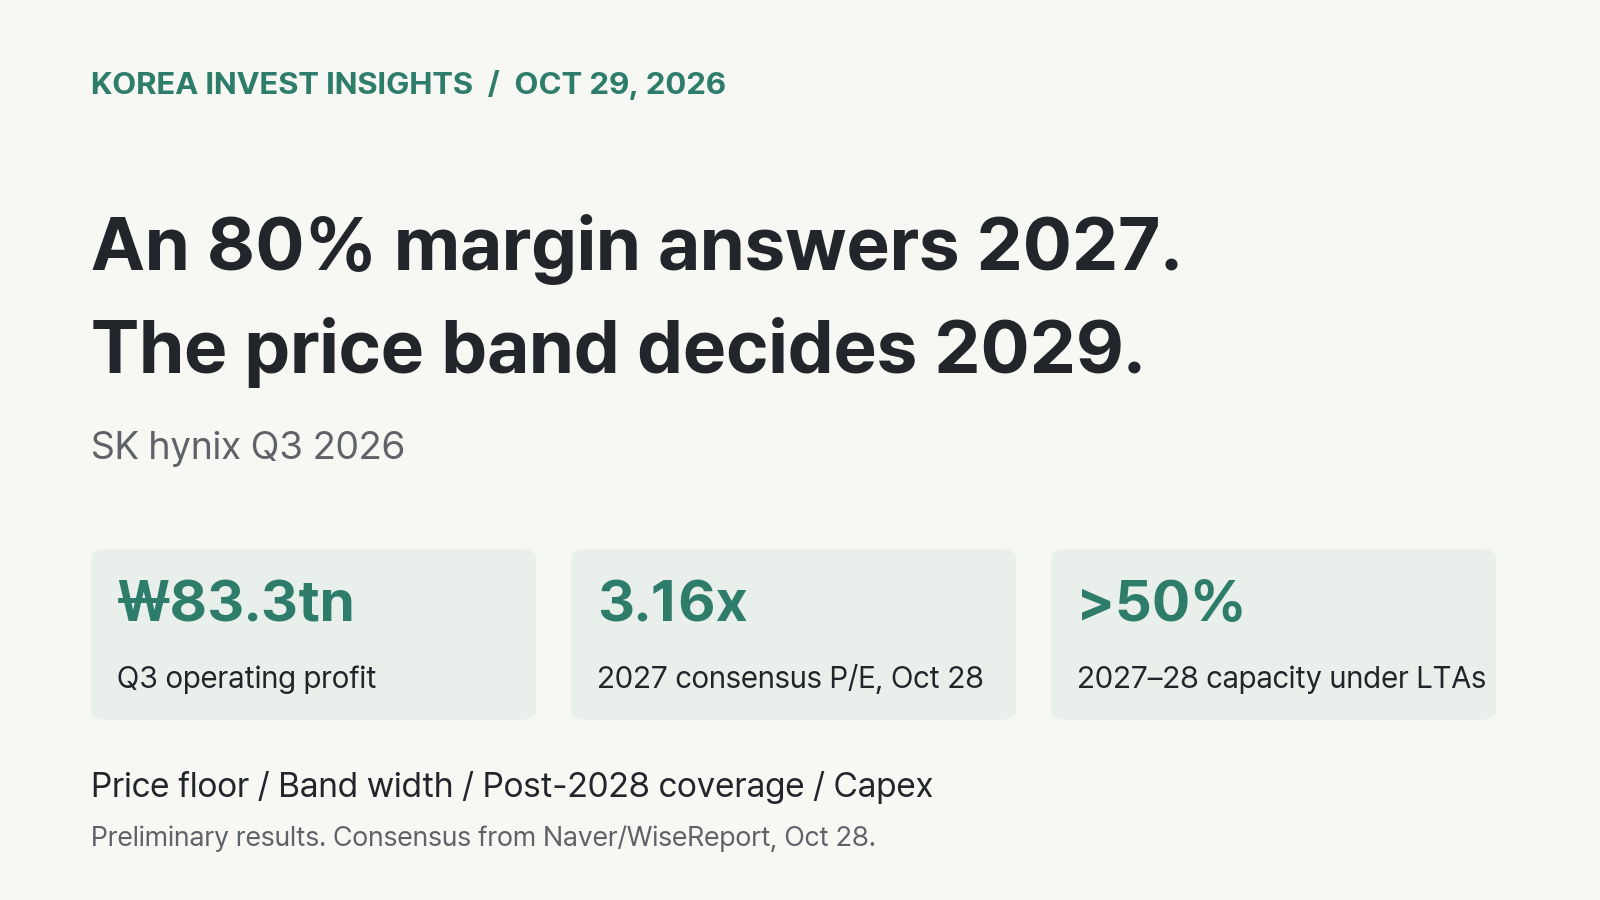
SK hynix reported ₩83.3 trillion of operating profit on ₩104.6 trillion of revenue for the third quarter. That is an operating margin of 80%. At average quarterly exchange rates, the profit is roughly $59 billion, about nine-tenths of the $64.0 billion non-GAAP operating income Nvidia reported for its quarter ended in July.
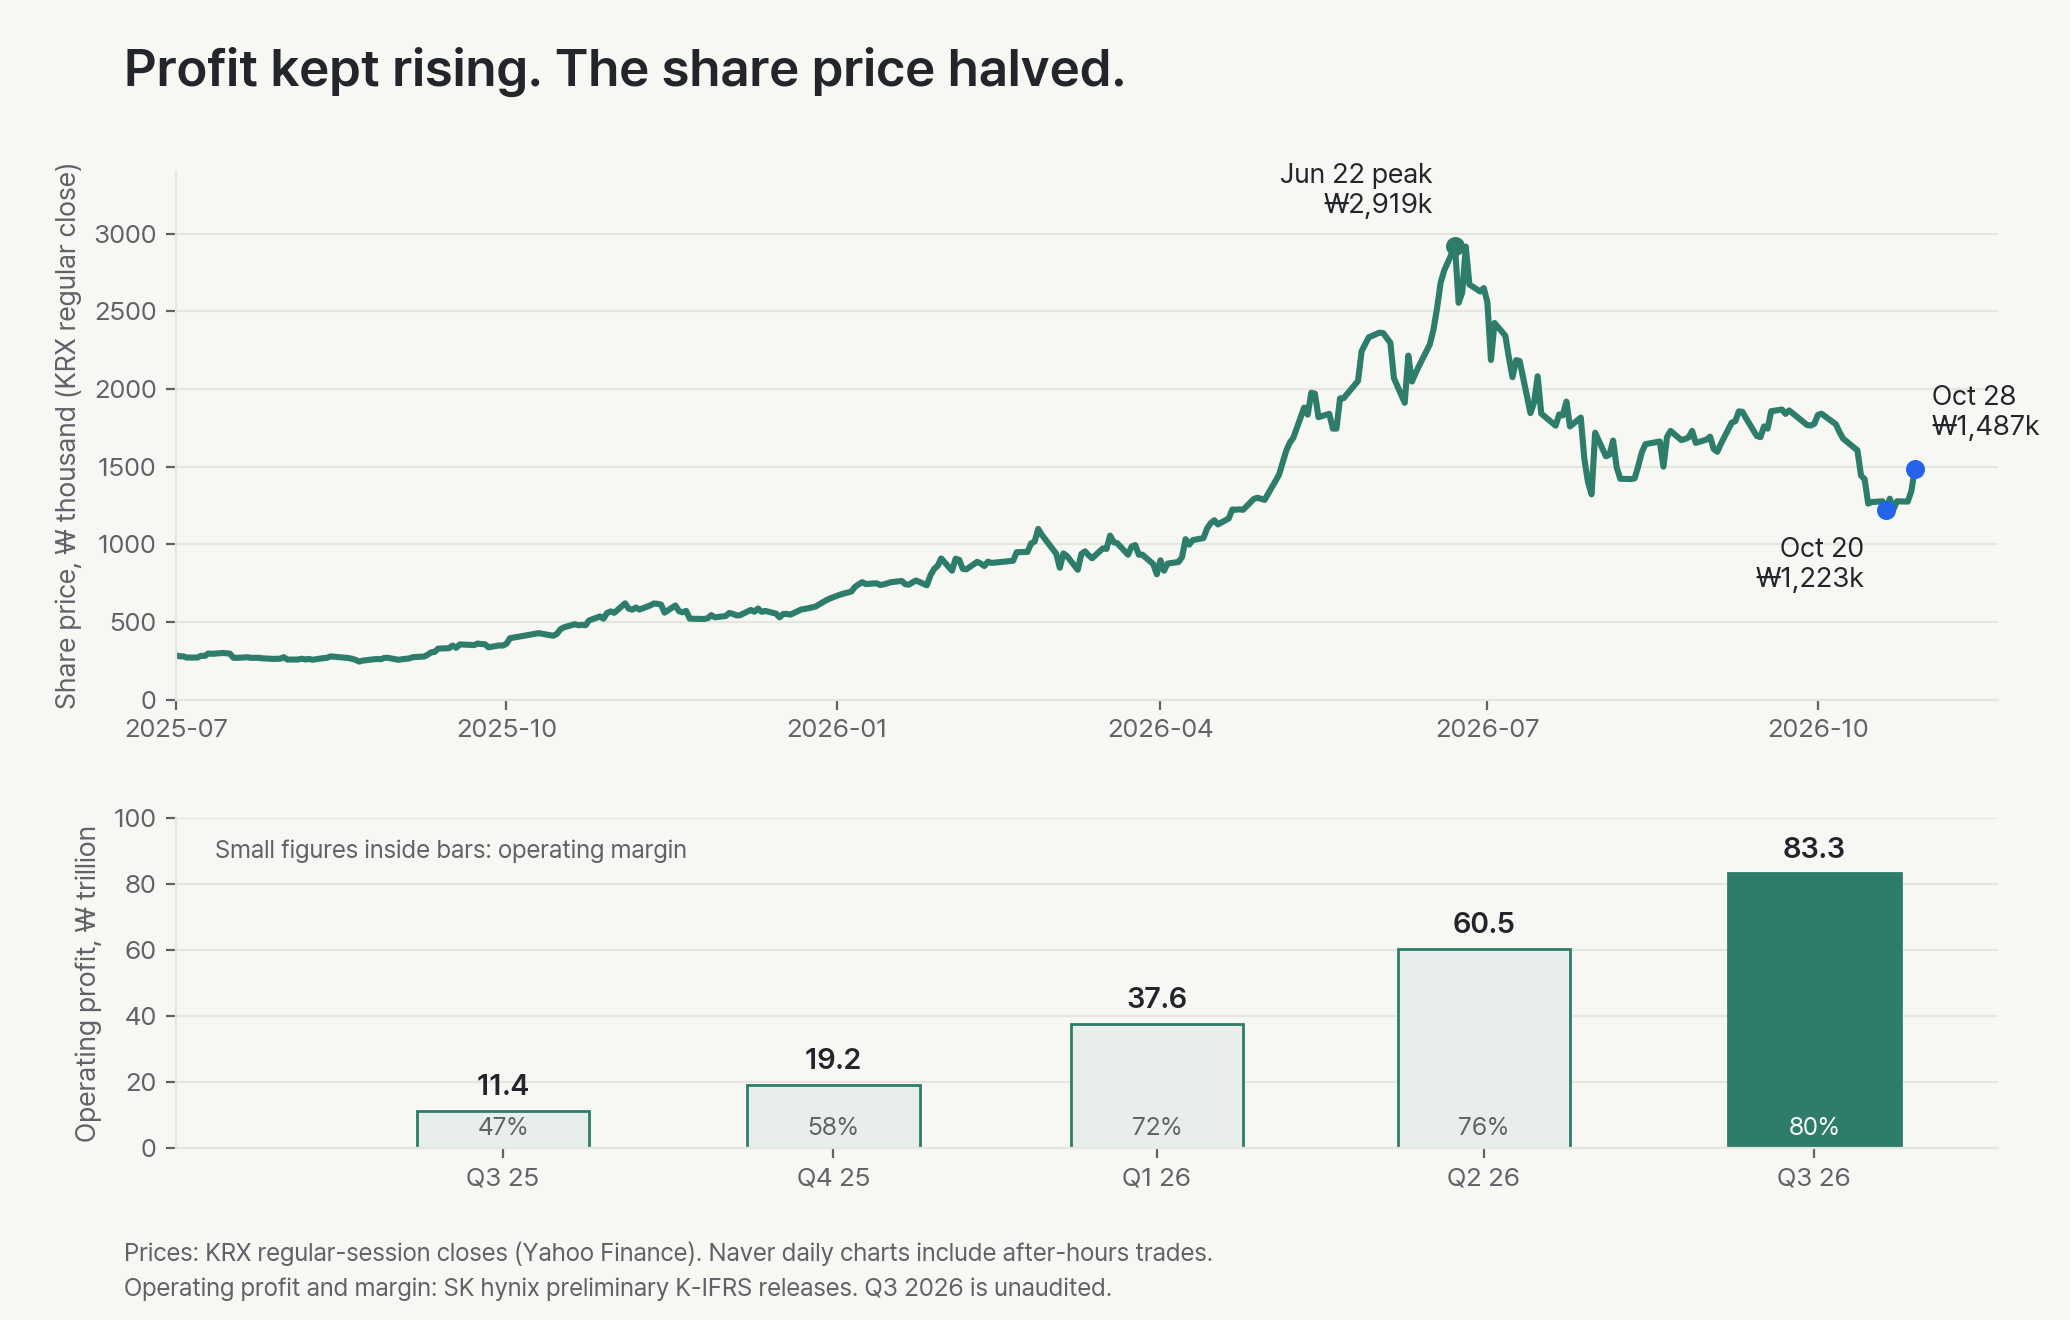
The stock closed at ₩1,487,000 on October 28. It rose 10.9% that day, but it is still 49% below its June 22 close of ₩2,919,000. Over the same months, quarterly operating profit rose from ₩60.5 trillion to ₩83.3 trillion. On the 2027 consensus, the shares trade at about 3.2 times expected earnings.
That gap is the real question. The market is not doubting 2027. It is pricing a steep fall in profit after 2028. The most important line in the release was therefore not the profit. It was this: long-term agreements with 14 major customers now cover more than half of 2027 and 2028 production capacity, at prices set “within a price range agreed upon with customers.”
Our judgment: the contract disclosure makes a 2027–28 earnings collapse unlikely, and the 3x multiple already prices a harsh fall after that. Whether that fall is too harsh depends on one undisclosed variable, the floor of the price band. This article explains why the floor dominates, what would show it is real, and what would prove the skeptics right.
This article is dated October 29, 2026, before Samsung Electronics’ 10 a.m. KST earnings call. Korean prices are KRX regular-session closes, not after-hours trades. Naver Finance daily charts include after-hours trades and can show different numbers, such as ₩1,508,000 for October 28. SK hynix’s Q3 figures are preliminary and unaudited.
Five things to take away
- The profit is real, and in dollars it grew faster. Operating profit rose 38% in won terms from Q2. The won strengthened during the quarter, so in dollars the increase was about 46%.
- Net income fell 58%, but memory did not. Q2 net income included ₩53.24 trillion of valuation gains on financial instruments. Kioxia’s share price fell about 40% in Q3. Screens built on net income will misread this company in both directions.
- More than half of 2027–28 capacity is contracted, with a price band. The company did not disclose the floor, the band width, minimum purchase terms or coverage after 2028. Those details decide whether the contracts protect profit or only reserve volume.
- SK hynix is also building the supply that will test the band. Investment will “increase significantly” next year as the Yongin Phase 1 fab starts full operation. The company forecasts a shortage through 2030. That is a forecast, not a contract.
- The ₩100 trillion payout is a plan; ₩24 trillion of new shareholder returns was approved this week. The “₩210 trillion” headline adds the top of Samsung’s existing plan range to SK hynix’s plan. The recurring signal is the promise to buy back shares every quarter.
The quarter was real, and in dollars it was bigger
The question here is simple: did the business actually improve, or did accounting and currency flatter it? The operating line answers it.
| Quarter | Revenue (₩tn) | Operating profit (₩tn) | Operating margin | Approx. operating profit ($bn) |
|---|---|---|---|---|
| Q3 2025 | 24.45 | 11.38 | 47% | 8.2 |
| Q4 2025 | 32.83 | 19.17 | 58% | 13.2 |
| Q1 2026 | 52.58 | 37.61 | 72% | 25.7 |
| Q2 2026 | 79.32 | 60.54 | 76% | 40.3 |
| Q3 2026 | 104.62 | 83.33 | 80% | 58.8 |
Revenue rose 32% and operating profit 38% from Q2. Dollar figures use the average of daily USD/KRW quotes for each quarter (about 1,501 in Q2 and 1,417 in Q3). They are our approximation, not company figures. The won strengthened about 6% between the two quarterly averages, so the dollar growth was larger than the won growth. SK hynix Q3 release, Q2 release, Q1 release, USD/KRW history.
The company attributed the quarter to higher prices for key products, strong server DDR5 sales and the start of volume HBM4 shipments. It expects HBM4 to pass HBM3E in both shipments and revenue in the fourth quarter. Cash and equivalents reached ₩114.5 trillion, borrowings fell to ₩15.8 trillion and net cash rose to ₩98.7 trillion.
The Nvidia comparison needs two caveats. Nvidia’s figure is non-GAAP and covers May–July; SK hynix’s is K-IFRS and covers July–September. The point is scale, not a like-for-like ranking. A memory maker now earns operating profit in the same order of magnitude as the company that buys much of its HBM. Nvidia Q2 FY2027 results.
Net income fell 58% because of Kioxia, not memory
Third-quarter net income was ₩39.8 trillion, down 58% from ₩93.9 trillion in Q2. Anyone screening on trailing earnings will see a collapse. The operating business shows the opposite.
The Q2 figure was inflated. SK hynix’s half-year report shows ₩53.24 trillion of valuation gains on financial instruments in that quarter, largely linked to its Kioxia investment. We discussed that in our October 25 fair P/E analysis. In Q3 the move reversed. Kioxia’s shares fell from about ¥29,900 on June 30 to ¥18,095 on September 30, a drop of about 40%. Kioxia price history.
The release does not itemize the gap between operating profit and net income. Before the release, our estimate of the Q3 valuation loss on SK hynix’s remaining Kioxia-linked convertible bond was ₩20–25 trillion. That estimate scales the bond’s book value by Kioxia’s share price and ignores currency and contract terms. The reported net income is consistent with a loss of that size after tax, but the company has not confirmed the figure.
The same effect may repeat. Kioxia closed at ¥12,605 on October 27, about 30% below its September 30 level. If it stays near there, the same rough method points to a further non-cash loss of roughly ₩9–12 trillion in Q4. For this company, operating profit is the cleaner measure of the memory business. Net income will swing with a Japanese stock price.
The market is not pricing 2027. It is pricing what comes after
At ₩1,487,000 and a 2027 consensus EPS of ₩470,589, SK hynix trades at 3.16 times expected 2027 earnings. On October 23 the same calculation gave 2.81 times. Since then the price has risen 16.4%, while the 2027 EPS estimate has risen 3.7%. Consensus is the Naver/WiseReport figure collected on October 28; some analysts may not yet reflect the release.
Another way to see it: the market value at the regular-session close was about ₩1,086 trillion. Subtracting ₩98.7 trillion of net cash leaves an enterprise value of roughly three times the Q3 operating profit annualized. Annualizing one quarter is not a forecast. It shows how little the price assumes about profit lasting.
In our October 25 analysis, the price implied that SK hynix’s normalized earnings would fall to about 18% of the 2027 level. That is the bet the market is making. It is a bet on price, not on volume. Few investors doubt that SK hynix will sell its 2027 output. The doubt is what that output will be worth once new fabs arrive.
October 28 also brought a broad rally. The KOSPI closed at 6,012.44, up 6.63%, and the exchange triggered a buy-side “sidecar” pause for the second day in a row. KOSPI data, sidecar report. A sidecar is a temporary halt on program orders after a sharp futures move. It does not identify who was buying. The public data we could verify do not yet show whether foreign investors were covering futures shorts. We treat the rally as price evidence, not as proof that selling has ended. Our rebound case from October 24 set out the conditions that would confirm it.
What the contracts say, and what they leave out
The release makes four specific claims about long-term agreements (LTAs):
- SK hynix has signed LTAs with 14 major customers, including leading global cloud providers.
- Contract terms are typically five years, and the company is discussing longer terms with several customers.
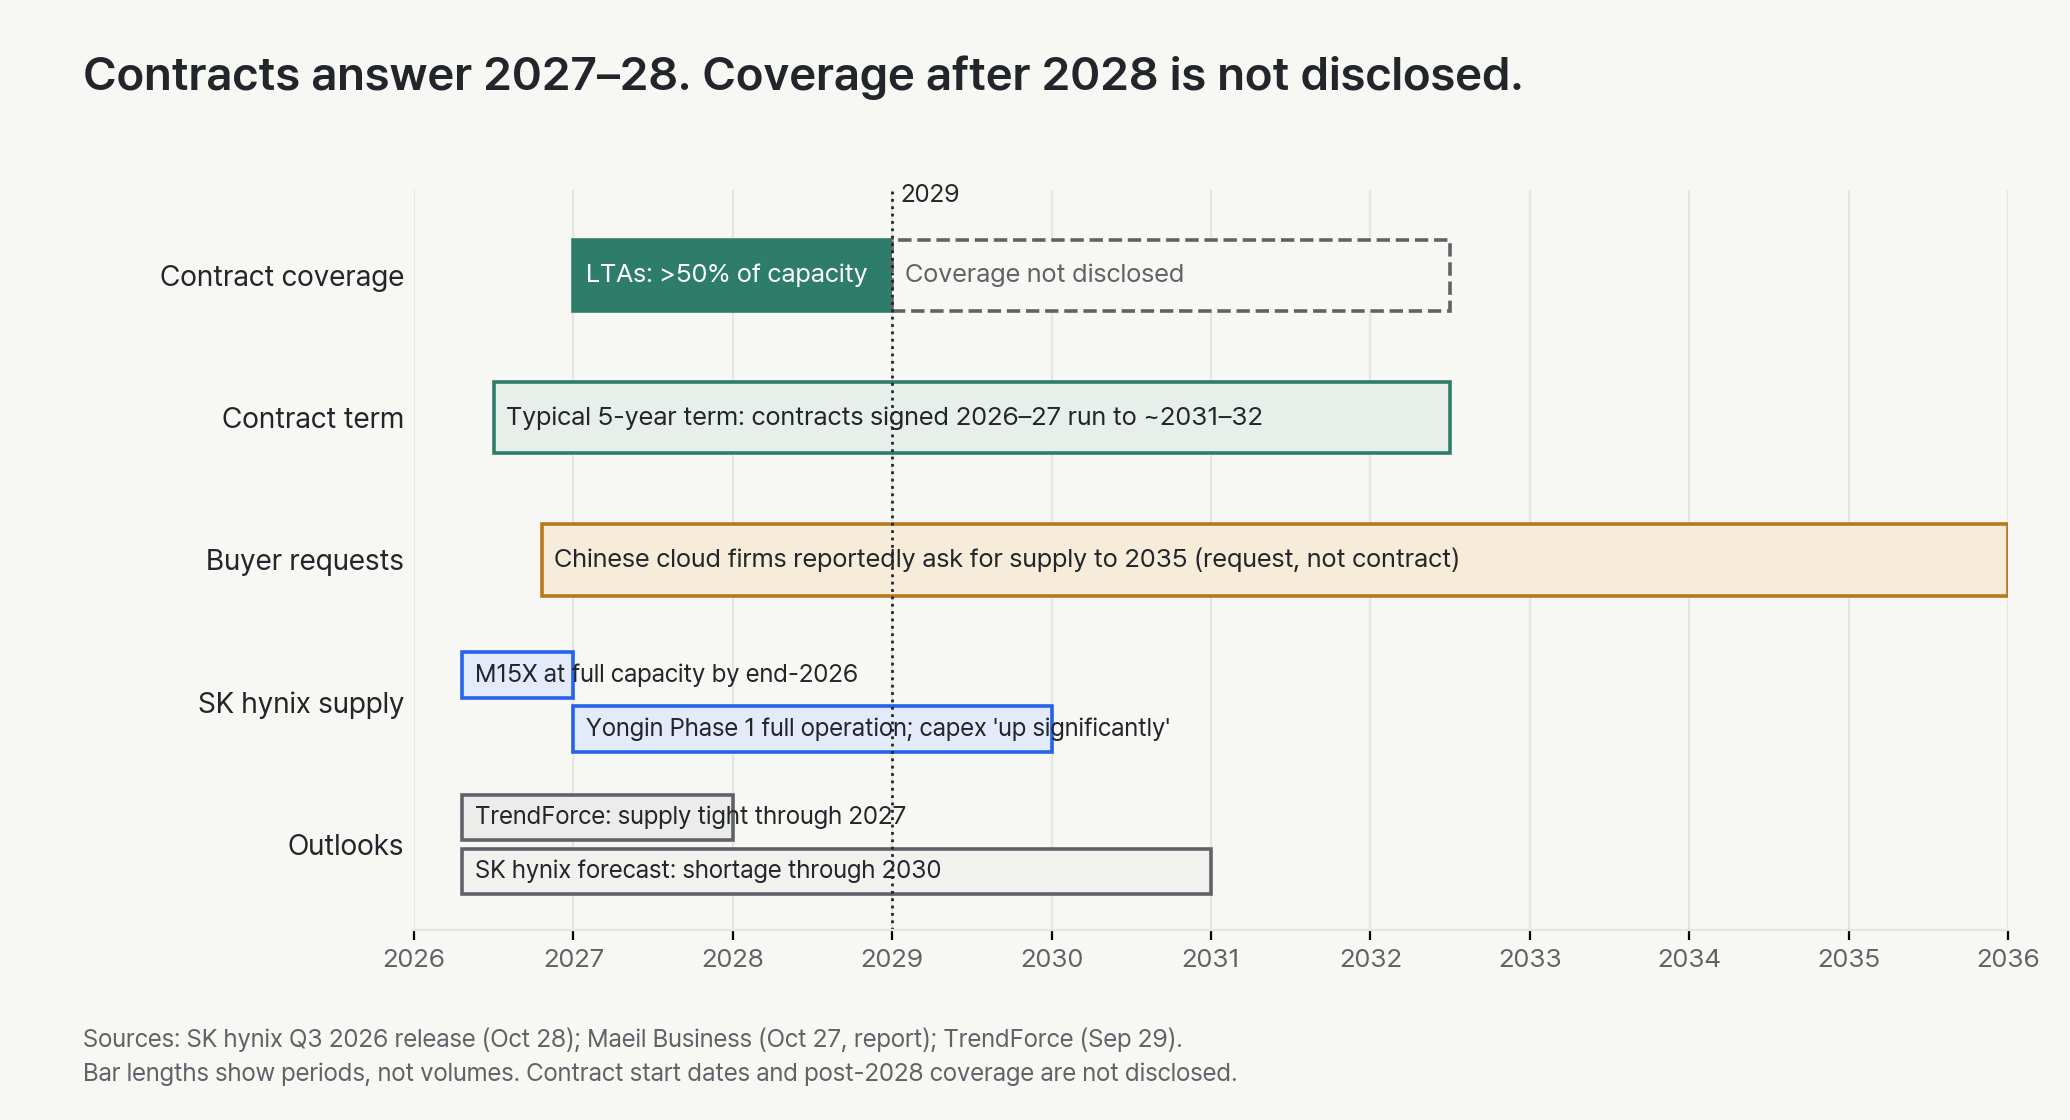
- Contracted volume equals more than 50% of total production capacity for 2027 and 2028.
- Prices reflect market conditions within a price range agreed with customers.
The fourth point is the one that matters for valuation. Volume certainty was never the bear case. A price range turns part of memory pricing from a spot market into a corridor. In a shortage, the ceiling costs SK hynix some upside. In a glut, the floor protects it. Which side matters more depends on where the corridor sits.
| Question | Disclosed on October 28 | Not disclosed |
|---|---|---|
| How much volume is contracted? | More than 50% of 2027 and 2028 capacity | Coverage for 2029 and later |
| How many customers? | 14 major customers | Customer concentration and the HBM share of contracted volume |
| How is price set? | Market-linked, within an agreed range | Floor level, band width, reset frequency |
| What binds the buyer? | Not described | Minimum purchase, take-or-pay, prepayments, cancellation terms |
| How long? | Typically five years | Start dates; contracts signed in 2026–27 would run to about 2031–32 |
A brokerage commentary on October 28 said SK hynix had sold DRAM and HBM output through 2029. We could not find that statement in the published results materials. Correction, October 29: Korean press reports of the earnings call confirm that SK hynix described DRAM and HBM as effectively sold out through 2029. The basis it gave was LTA volume already secured plus demand under concrete discussion, so the statement describes how much demand the company can see, not signed volume at fixed prices. Coverage for 2029 and later is still not disclosed. An earlier version of this article treated the statement as unconfirmed. Asia Business Daily, our follow-up on contract quality.
Other evidence points the same way, with lower certainty. On October 27, Maeil Business Newspaper reported that Alibaba, Tencent and ByteDance had asked Samsung and SK hynix for long-term server DRAM supply, with some requests running up to ten years, to 2035. Maeil Business report. That is a report of a request, not a signed contract. US export rules restrict HBM sales to China, and some conventional DRAM may also need licenses depending on specifications and end use. KB Securities separately estimates that 70–80% of both companies’ planned 2027 memory volume is covered by five-year LTAs. That is a broker estimate, not company data. KB Securities, October 26.
TrendForce’s public summary of its October 7 DRAM bulletin describes the same structure: multi-year server DRAM contracts, with price-band mechanisms on many of those volumes and the remainder priced quarterly. TrendForce DRAM bulletin. When buyers ask for ten-year terms, they are telling you which side of the band they fear. They fear paying more, not being stuck with too much.
SK hynix is also building the supply that will test the band
The release says investment will “increase significantly” next year. Yongin Phase 1 enters full-scale operation, and the M15X fab will run at maximum capacity by the end of 2026 to raise HBM4 output. The company adds that it will adjust the scale and timing of investment flexibly.
This is the honest tension in the story. The company that forecasts a shortage through 2030 is also adding capacity, and so are its competitors. The shortage claim rests on the difficulty of leading-edge processes and long fab lead times. That is a reasonable argument, but it is the company’s forecast.
Independent forecasts support the near term. TrendForce expects memory supply to stay tight through 2027 and projects a 121% rise in blended HBM prices in 2027, driven by supply limits, more HBM4 and the start of HBM4E. It also notes that GPU and ASIC makers are considering 8-high HBM stacks to save cost; those carry a 10–20% higher price per gigabit than 12-high stacks. TrendForce, September 29. None of this extends to 2029.
So the band floor and the supply response are linked. If new supply arrives in 2028–30 and spot prices fall, the floor is what protects contracted volume. If the floor is close to today’s contract prices and the buyer must take the volume, the market’s 18% normalization looks too harsh for the contracted half. If the band is wide or resets each year, the contracts mostly guarantee shipments, and the skeptics are right to apply a cyclical multiple.
The payout: ₩100 trillion is a plan; ₩24 trillion was approved this week
A Korean newspaper headline on October 27 put Samsung’s and SK hynix’s combined shareholder returns at “₩210 trillion or more.” The number adds different things. Here is what SK hynix actually said on October 28. SK hynix Q3 release, Hankyung report.
| Item | Amount | Status |
|---|---|---|
| FY2026 shareholder return plan | About ₩100tn | Plan: cash dividends of ₩30tn or more, plus buybacks and cancellations of ₩60tn or more |
| August buyback | ₩40tn | Completed last week; shares to be cancelled shortly. Counted inside the ₩60tn |
| Q3 cash dividend | ₩14tn | Approved October 28: ₩20,000 per share, half regular and half a special dividend from Kioxia gains |
| New buyback for cancellation | ₩10tn | Approved October 28; counted as a shareholder return |
| New buyback for employee pay | About ₩10tn | Approved October 28; excluded from the return total |
The ₩24 trillion of new shareholder returns approved this week is the ₩14 trillion dividend plus the ₩10 trillion buyback for cancellation. To reach its own floors by year-end, the company still has to pay more dividends and buy back at least another ₩10 trillion for cancellation. The release does not say how much of the dividend floor was already paid earlier in the year.
For market flows, both new buybacks matter, because both buy shares in the market. For per-share value, only the cancelled ₩10 trillion counts. The release does not give an execution period, so the daily buying pressure is unknown.
On the Samsung side of the headline, the ₩110 trillion is the top of the ₩90–110 trillion range Samsung announced on August 21. It is not a new increase. Samsung plans to set dividend details at its October board meeting and the remaining return at a January 2027 board meeting. Samsung Electronics, August 21.
The special dividend is a one-off; it returns an investment gain. The more telling line is the stated principle that buybacks “will continue every quarter.” A management team that expected a 2027 cash cliff would be unlikely to promise that. It is a principle, not an amount, so it supports the 2027–28 view and says nothing about 2029.
Our judgment, and what would change it
We side with the contracts for 2027–28 and with the skeptics for 2029–30, until the floor is disclosed. The Q3 release lowers the risk of a near-term earnings collapse more than a 3x multiple implies. It does not yet justify valuing post-2028 profit as if it were contracted.
Three variables decide the case. The band floor dominates, because it is the only one that directly limits how far contracted profit can fall. Supply response comes second; it decides when the floor is tested. Customer returns on AI spending come third; they decide whether buyers want to renegotiate.
| Evidence | What it would mean |
|---|---|
| SK hynix, Samsung or Micron says the floor sits near current contract prices, with minimum purchase or prepayment terms | The market’s normalization assumption looks too harsh for contracted volume; the discount to 2027 earnings should narrow |
| LTA coverage is disclosed for 2029–30 at levels near the 2027–28 share | The “2027 answered, 2029 open” framing would need revision toward durability |
| Bands are described as wide, reset annually, or tied to spot prices | The contracts mainly secure volume; a cyclical multiple remains justified |
| Industry capex guidance for 2027 rises faster than expected bit demand | The floor will be tested sooner, around 2028 |
| Hyperscaler capex guidance is cut, or buyers seek to defer LTA volume | Renegotiation risk rises; the contract floor matters more than the headline coverage |
The next checks are close. Samsung Electronics holds its earnings call at 10 a.m. KST on October 29; the useful question is whether it describes its own LTA pricing terms, not only the dividend. Microsoft reports after the US close on October 28, early on October 29 in Korea, and third-party calendars place Alphabet and Amazon in the same window; Meta reported on October 21. Their capex and lease guidance shapes buyer behavior in 2027. Kioxia’s share price will decide how SK hynix’s Q4 net income looks.
Which disclosure would change your view most: the level of the LTA price floor, the contracted share of 2029–30 capacity, or the industry’s 2027 capex plan? Tell us what number would convince you.
Research and information only; not investment advice. Estimates and scenarios are analytical assumptions, not company guidance, trade instructions or personalized portfolio decisions. Figures are date-bound. AI tools assisted research and editing.