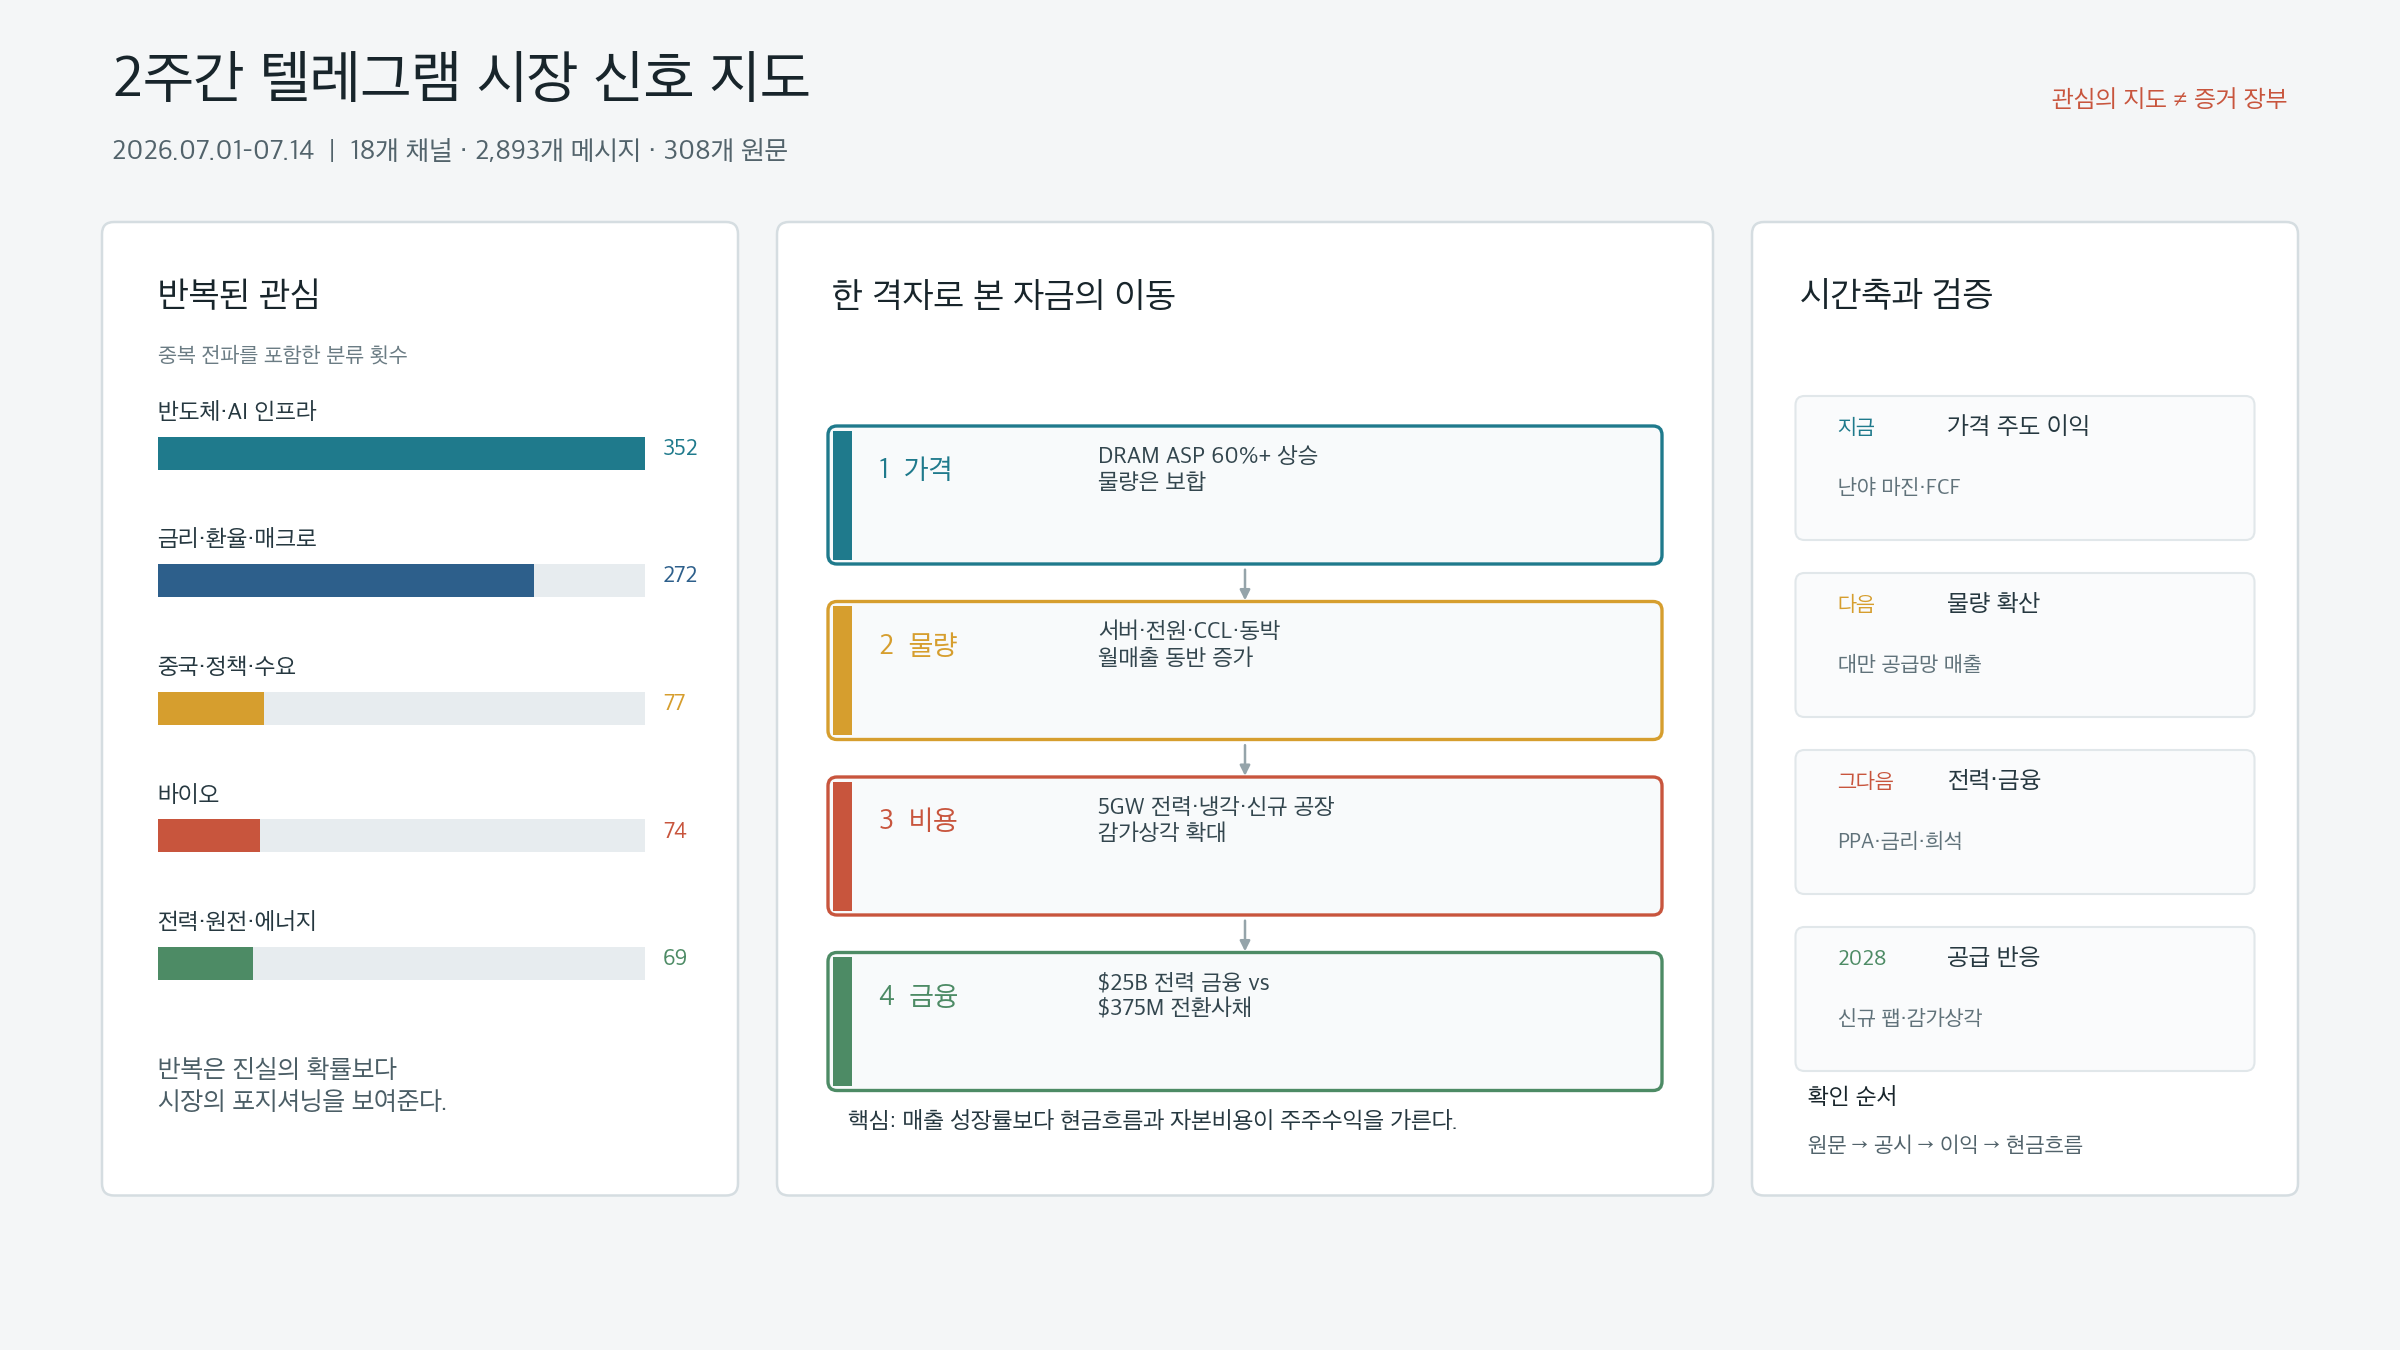
Between July 1 and July 14, 2026, 2,893 messages were collected from 18 Telegram channels. Of these, 1,890 were classified as high-information-density, and 308 were original source documents after stripping forwards and reposts. The most frequently recurring topics were: semiconductors and AI infrastructure (352 mentions), interest rates, currencies, and macro (272), China, policy, and demand (77), biotech (74), and power, nuclear, and energy (69).
These numbers should not be read directly as a measure of market conviction. When the same article or brokerage memo circulates across multiple channels, the message count rises without adding a single new fact. Conversely, a single official disclosure may not be widely shared yet can carry far greater impact on company valuations. Telegram is a map of attention — it shows what the market is watching. It is not a ledger of confirmed facts.
This post re-selects from those 308 source documents the signals most likely to alter market structure. Nanya Technology’s quarterly results, monthly revenue from TSMC, Wiwynn, Delta, CCL makers, and copper foil producers, Meta’s 5 GW data center plan, Brookfield and Bloom Energy’s $25 billion power financing, Fermi’s convertible notes, Micron’s U.S. capacity expansion, Korea’s single-stock leveraged products, and SK Hynix ADR discussions were read in cross-reference against one another.
Connected context: This post is a follow-up that re-links the H1 2026 AI infrastructure and narrow market postmortem, the Micron FY3Q26 earnings analysis, the KOSPI sell-off and leverage amplification analysis, and the AI token and memory value-added analysis through the flow of source documents from the first half of July.
TL;DR
- Memory earnings are still being driven by price, not volume. Nanya Technology’s Q2 DRAM average selling price rose more than 60% quarter-on-quarter while shipment volume barely changed. Current excess profits are powerful, but earnings sensitivity to any price reversal is equally high.
- AI investment has spread beyond GPUs and HBM to server ODMs, power supply units, liquid cooling, advanced copper foil, and CCL. Taiwan’s supply chain June revenue confirms this shift.
- The next bottleneck is power, and after power comes financing. Meta’s 5 GW plan and Brookfield’s $25 billion financing commitment show the scale of demand. Fermi’s $375 million convertible notes show that the same investments carry dilution and refinancing risk.
- Supply shortage is sowing the seeds of future supply. From 2028, when Nanya’s new fab, Micron’s U.S. investments, and the three major memory makers’ capacity expansions converge, demand qualification cycles and depreciation will matter more than demand growth alone.
- In the Korean market, fundamentals and trading structure must be separated. Single-stock leveraged products can amplify both gains and losses, and ADR premiums may be the price of arbitrage friction rather than an increase in enterprise value.
- The claim that more agents means infinite memory demand remains a narrative. Total inference volume and context storage are growing, but compression, cache reuse, tiered storage, and hardware-software co-design are lowering cost per byte.
- The most important final metric is not AI capex. It is how much the end customer pays per unit of useful work completed, and how that money is divided among power, server, networking, and memory suppliers.
1. How to Read Two Weeks: Evidence Quality Over Message Count
1.1 2,893 Messages Are Not 2,893 Events
The most frequently captured topic over the two weeks was semiconductors and AI infrastructure. But the number 352 does not mean 352 independent positive catalysts. When a single brokerage report passes through an original channel, a repost channel, and a summary channel, it gets counted three or more times. The same article with only a changed headline also repeats.
This analysis therefore divided messages into four tiers.
| Tier | Basis | How to Use | Examples |
|---|---|---|---|
| A | Company IR, regulatory filings, official announcements | Factual reference point | Nanya results, TSMC monthly revenue, Meta capex, SEC filings |
| B | Brokerage and industry data with figures and sources | Cross-checked against primary materials | Taiwan component IR summaries, industry supply/demand forecasts |
| C | Anonymous sourcing, Telegram interpretation, market memos | Signal of possibility and sentiment | Meta surplus compute sales, Samsung HBM yield, ADR premium |
| D | Long-term narratives and extreme forecasts | Material for forming questions | 10 billion agents, infinite memory demand growth |
Even if the same claim appears across multiple channels, if the original source is one, the evidence is one. Conversely, a single Tier A document can matter more than ten Tier C posts. Collection on July 14 may have partial gaps due to Telegram web domain connection errors, so that final day’s frequency is best excluded from comparisons.
1.2 Repetition Reveals Positioning, Not Truth
Repetition itself has its uses. What it reveals, however, is market participants’ attention and positioning, not the probability that something is true.
- When multiple channels share the same HBM price increase, it means the memory bull thesis is already widely held.
- When posts about leveraged ETF side effects repeat, it means supply/demand anxiety has become investors’ primary explanatory frame, independent of actual product scale.
- When power and cooling articles multiply, it means the market is searching for bottlenecks beyond GPUs.
- When ADR premium posts repeat, it means U.S.-listing structure has become a short-term price catalyst, overshadowing domestic earnings fundamentals.
The correct sequence for using Telegram in investment is therefore: detect repetition → verify source document → cross-check against official data → connect to earnings and cash flow → check price reflection. Jumping from repetition detection directly to buying means purchasing the most crowded narrative at the latest possible entry.
2. Mapping Two Weeks of Markets onto a Single Grid
Placing the two weeks of source documents on four axes — price, volume, cost, and financing — makes the pattern clear.
| Axis | Signal Confirmed in First Half of July | Investment Question |
|---|---|---|
| Price (P) | Nanya DRAM ASP up more than 60% QoQ, memory supply shortage expected | How long does the price increase persist? |
| Volume (Q) | Taiwan server, power, CCL, copper foil monthly revenue up; Meta 5 GW plan | Are actual shipments and utilization rates growing as fast as the narrative? |
| Cost (C) | Grid power, cooling, new fabs, depreciation, U.S. production costs | Does revenue growth translate into margin and free cash flow? |
| Financing (F) | $25B power financing, $375M convertible notes, long-term contracts and prepayments | Who provides the capital, and who bears dilution and refinancing risk? |
Market narratives typically emphasize P and Q — prices are rising and demand is growing. But the durability of stock performance is determined by C and F. If the cost of building fabs and securing power surges, or if debt maturities arrive quickly, strong demand may not translate into strong shareholder returns.
Within this grid, the key themes of the first half of July are:
- P is very strong. Memory prices are explosively expanding producer earnings.
- Q is also diffusing beyond chips. Server ODMs, power supply, cooling, and substrate raw materials all grew together.
- C is rising. Power, fab construction, cooling, and U.S. production costs are the next constraints on investment.
- The gap in F has widened. The divergence is growing between companies that can secure long-term capital cheaply and those that depend on dilutive funding.
3. What Nanya Technology Revealed About the Nature of Memory Earnings
If one had to pick the single most important source document from the two weeks, it would be the Nanya Technology FY2Q26 earnings summary. But more important than the Telegram post is the separation of price and volume in Nanya Technology’s official earnings release.
3.1 The Numbers
| Item | FY2Q26 | QoQ | YoY |
|---|---|---|---|
| Revenue | NT$82.549B | +68.2% | +684.2% |
| Gross margin | 79.5% | +11.6pp | Large improvement |
| Net income | NT$50.192B | Increase | Expanded profit |
| EPS | NT$14.66 | Increase | Increase |
| Operating cash flow | NT$55.013B | Increase | Increase |
| Net capex | NT$4.046B | Limited | Limited |
| Adjusted free cash flow | NT$50.967B | Surge | Surge |
A 79.5% gross margin looks like a software company, yet the business is DRAM. The reason is price, not volume. According to company disclosures, DRAM average selling prices rose more than 60% quarter-on-quarter while shipments were nearly flat.
Revenue change ≈ Price change × Volume change
Nanya FY2Q26 = Price surge × Flat volume
This structure simultaneously explains the advantage and the risk of the current memory bull cycle.
- Advantage: When prices rise without additional wafers, a large portion of the revenue increase flows directly to operating income and cash flow.
- Risk: When price appreciation slows, volume growth cannot fill the gap, and earnings sensitivity works in reverse.
- Optical illusion: Applying a high P/E multiple to a peak-cycle gross margin means being bullish on both price and multiple simultaneously.
3.2 Why This Cycle May Last Longer Than Previous Ones
Nanya reported low inventory, AI infrastructure and server revenue exceeding 20% of the mix, and a supply shortage expected to continue for multiple quarters. Long-term supply contracts are also increasing. As HBM and server DRAM absorb wafer capacity and leading-edge process nodes, commodity DRAM supply has tightened as well.
Micron similarly emphasized long-term customer contracts, price floors and ceilings, prepayments, and supply commitments in FY3Q26. As confirmed in the Micron earnings analysis, long-term contracts can extend the duration of memory earnings.
But long-term contracts do not eliminate the cycle.
- Contracts transform price risk into repricing-at-renewal risk and customer credit risk.
- Price ceilings protect downside but can cap additional upside during rapid price appreciation.
- Non-HBM DRAM and NAND remain exposed to spot and contract pricing cycles.
- When customers absorb excess capacity, they renegotiate volumes and prices in the next contract cycle.
3.3 Supply Shortage Is Seeding 2028 Supply Expansion
Nanya has set a FY2026 capex cap of NT$52B, and phase one of its new fab targets monthly output of 30,000 wafers by 2028, with estimated total investment of $16 billion for full 45,000 wafer-per-month capacity. Micron also announced plans to invest more than $250 billion in the United States through 2035, targeting 40% of global DRAM production on U.S. soil, per Micron’s official announcement.
The current supply shortage is real. At the same time, that shortage is building new supply and creating depreciation loads for 2028 and beyond. Investors must therefore hold two sentences simultaneously:
Memory prices and earnings in 2026–2027 may be strong. Beginning in 2028, the pace at which incremental capacity passes customer qualification and the weight of accumulated depreciation must be recalculated.
4. Samsung Electronics and HBM4E: Customer Shipments Matter More Than Yield Numbers
In early July, a widely circulated Telegram post reported that Samsung Electronics’ HBM4E trial yield had exceeded 70%. The source post is a secondary document relaying news coverage and internal commentary. It is not a number confirmed by Samsung’s official IR or customer qualification results.
Even if the 70% yield figure is accurate, three additional steps are required before it informs investment judgment.
- What process, stack configuration, and test stage does the yield refer to?
- Has it passed customer reliability testing and system-level qualification?
- Is commercial volume being shipped repeatedly and recognized as revenue?
In HBM, test yield, mass production yield, and customer qualification yield are not the same number. The most common error the market makes is mapping a strong internal test result directly to customer revenue.
Samsung Electronics earnings forecasts circulating over the same period also require careful categorization. The Samsung memory-related post relays brokerage estimates and industry interpretation. Q2 operating income, bonus accruals, NAND pricing, enterprise SSD and KV-cache demand, and foundry customer discussions are all mixed into a single post. Items that are not official earnings releases or contract disclosures should remain as estimates.
Nonetheless, some directional conclusions are valid.
- HBM shortages are reshuffling DRAM wafer allocation.
- As inference workloads grow, enterprise SSDs and NAND may become more critical at the lower tiers of the memory hierarchy.
- The investment thesis for Samsung Electronics is not solely about HBM share recovery, but about the optionality of combining DRAM, NAND, foundry, and packaging within a single company.
- The value of that optionality rises when customer qualification and recurring revenue are confirmed.
5. Taiwan’s June Revenue Data Shows AI Investment Diffusion
The strongest cross-verification in these two weeks came from the monthly revenue of Taiwan’s supply chain. It was not a single company’s guidance — rather, revenue at different nodes of the value chain moved in the same direction.
| Company / Segment | June 2026 Revenue | MoM | YoY | What to Note |
|---|---|---|---|---|
| TSMC / Foundry | NT$442.680B | +6.2% | +67.9% | Sustained demand for AI compute chips and leading-edge processes |
| Wiwynn / Server ODM | NT$111.371B | +32.5% | +29.8% | AI server and general server shipment expansion |
| Delta / Power & Cooling | NT$65.603B | +11.3% | +55.4% | Power supply unit and liquid cooling demand diffusing |
| EMC / Advanced CCL | NT$17.733B | Increase per data | +120.7% | Growth in advanced materials for AI servers and 800G switches |
| TUC / Advanced CCL | NT$4.895B | +2.1% | +106.3% | Higher share of M7/M8 high-value products |
| Co-Tech / HVLP Copper Foil | NT$0.962B | +2.2% | +43.4% | Growing bottleneck in low-roughness copper foil for high-speed signals |
TSMC figures can be verified at the official monthly revenue page. Wiwynn, Delta, EMC, TUC, and Co-Tech figures were cross-referenced against Telegram source posts relaying each company’s IR. The Wiwynn, Delta, and Co-Tech posts are the primary references.
5.1 The Physical Bill Beyond the GPU
Adding one AI server requires more than a GPU.
Compute chip
  → HBM and DRAM
  → Server assembly and rack
  → Power supply unit and power conversion
  → Liquid cooling
  → High-speed PCB, CCL, HVLP copper foil
  → Optical modules and switches
  → Transformers, generation, grid interconnection
In 2024–2025, compute chips were the scarcest item. June’s monthly revenue data shows the bottleneck migrating to the periphery. The growth in CCL and HVLP copper foil in particular illustrates that materials reducing signal loss at higher data transfer rates gain value as speeds increase.
Year-over-year growth rates alone should not be used to confirm the duration of supply shortages.
- The prior-year base may be low.
- Price increases and volume growth must be separated.
- If new line ramp-ups drove revenue, the comparison base rises in subsequent quarters.
- Customer inventory building may be running ahead of end demand.
The correct verification sequence is therefore: revenue → shipment volume → average selling price → inventory → operating cash flow. If revenue rises while inventory and accounts receivable grow faster, orders may be running ahead of final consumption.
6. Optical Networking and CPO: Direction Is Right, Numbers Need More Verification
A post on optical networking and CPO presented a brokerage forecast that the global optical networking market could grow from $15 billion in 2026 to $154 billion in 2028, with CPO accounting for $91 billion. The same source projected that network value and optical module counts per next-generation rack would increase substantially, and that silicon photonics adoption rates would surge.
The directional case is persuasive. As GPU counts rise and data movement within and between racks grows, bandwidth and power constraints become increasingly difficult to resolve with electrical interconnects alone. Moving from 400G to 800G, 1.6T, and 3.2T makes light sources, lasers, silicon photonics, packaging, and precision alignment increasingly critical.
However, the market size figures could not be independently verified against the original report and methodology. It is therefore safer to read them as follows:
| Assessment | Judgment |
|---|---|
| Bandwidth becomes a bottleneck in AI infrastructure | High confidence |
| Optical module and silicon photonics share increases | Medium-high confidence |
| CPO market reaches $91B by 2028 | Secondary source; further verification needed |
| Specific Korean companies immediately capture large revenue | Unconfirmed until customer, component, and mass production disclosures |
In Korean equities, as covered in the optical networking and CPO value chain analysis, actual products and customer qualifications matter more than thematic labels. A company whose name includes “optical” is not the same company as one supplying components into 1.6T optical links in an AI cluster.
7. The Power Bottleneck Is Real: Meta’s 5 GW and Brookfield’s $25 Billion
Even with strong memory and server revenues, a data center generates no revenue if it cannot connect power. The clearest official data on this point from the first half of July came from Meta and Brookfield.
7.1 Meta Hyperion
Meta’s Louisiana data center expansion plan outlined up to 5 GW of compute capacity and more than $50 billion in investment, including more than $1 billion in local infrastructure, seven new gas power plants, three grid battery storage systems, nuclear output uprates, and power purchase agreements — with Meta bearing the costs of power, water, and infrastructure.
The importance of this announcement is not merely the scale of the numbers. It reflects the fact that AI data centers are evolving from semiconductor procurement projects into regional power system redesign projects.
Meta also announced in 2025 a joint venture with Blue Owl for Hyperion development and a structure to raise approximately $27 billion in development financing. The official announcement shows that even big tech prefers to share capital and risk with external investors rather than putting all facilities directly on its own balance sheet.
7.2 Brookfield and Bloom Energy
Brookfield and Bloom Energy expanded their AI infrastructure power project financing framework from an existing $5 billion to $25 billion.
This $25 billion should not be read as confirmed Bloom Energy revenue. A financing framework shows the ceiling and commitment of capital that can be deployed into projects. Actual revenue requires land, customers, power purchase agreements, fuel supply, equipment orders, and groundbreaking.
Nevertheless, the signal quality is high.
- Data centers find it difficult to wait for grid interconnection and are seeking on-site power solutions.
- Equipment vendor orders alone are insufficient — long-term financing must accompany them.
- Capital cost and contract structure may determine project cadence more than equipment availability.
- Profit sharing among big tech, infrastructure funds, and power operators becomes increasingly important.
8. Same Power Theme, Different Shareholder Outcomes: Fermi’s Convertible Notes
Strong power and data center demand does not mean all related equities perform well. The Fermi-related Telegram post illustrated this counterexample clearly.
Fermi priced $375 million of 5% convertible senior notes due 2031, with a potential over-allotment bringing the total to $431.25 million. Reading the SEC filing and final pricing release together, it is clear that the company is at the stage of funding large-scale data center ambitions through capital markets before those ambitions generate revenue.
When evaluating power themes, announced GW targets and confirmed cash flows must be distinguished.
| Stage | Evidence to Verify | Meaning for Shareholders |
|---|---|---|
| Concept | Site, target GW, development plan | Optionality exists but no revenue |
| Contract | Customer, PPA, minimum usage commitments | Revenue visibility begins |
| Financing | Interest rate, collateral, conversion price, maturity | Dilution and refinancing risk determined |
| Construction | EPC, equipment orders, permits | Cost and schedule risk materializes |
| Operations | Utilization, power cost, load factor | Operating cash flow confirmed |
Brookfield’s $25 billion and Fermi’s $375 million are both AI power investments. The former shows the strength of long-term infrastructure financing; the latter shows the dilution cost borne by shareholders of a development-stage company with no revenue yet. Even within the same theme, the quality of capital determines shareholder returns.
9. Meta’s Excess Compute Sales: Evidence of Oversupply or an Option?
A Meta cloud-related post covered reports that Meta is exploring selling AI computing capacity beyond its own internal use to external customers. This plan is based on a Bloomberg report citing anonymous sources at the planning stage. No confirmed product, pricing, or contract scale has been disclosed.
This news can be read two ways.
Bearish Reading
- Meta has secured more capacity than it needs.
- The pace of monetization from internal AI services has not kept up with capacity expansion.
- Selling surplus compute signals a coming slowdown in capital expenditure.
Bullish Reading
- Training and inference demand varies by time-of-day and project.
- Selling unused capacity to external customers improves asset turnover and return on investment.
- It creates an incremental revenue stream beyond advertising.
- It lowers the downside of large-scale preemptive investment, creating an embedded option.
Current data alone cannot determine which reading is correct. The necessary indicators are:
- External sales volume and pricing
- GPU utilization rate for internal workloads
- Contribution margin inclusive of depreciation and power costs
- Additional capex guidance
- Minimum usage commitments from customers and contract duration
The ability to sell surplus capacity reveals the possibility of overcapacity but is not itself evidence of overcapacity. In the best case, it is monetization of underutilized assets; in the worst case, it is a post-hoc response to overestimated internal demand.
10. The Agent Era and Memory Demand: Translating Narrative into Physical Quantities
A long-term outlook post on agents and memory presents a vision where AI advances through infrastructure construction, operations, an agent economy, and inter-agent transactions, making memory the foundation of civilization. Numbers like 10 billion agents are not validated forecasts — they are long-term narrative.
But the question the post raises is valid. Agents use longer state and more tool calls than a chatbot that answers and exits. Breaking work into multiple steps, retaining prior results, and exchanging information with other agents can increase total inference volume and stored state.
To translate this into memory demand, five variables must be tracked separately.
Total memory demand
≈ Number of useful tasks
× Inference steps per task
× Active context per step
× Fraction of context residing in memory
÷ Compression, cache, quantization, and routing efficiency
The bull case emphasizes the first four variables. The counter-argument is that the efficiency denominator is improving rapidly.
- KV cache compression and reuse
- Speculative decoding
- Routing between small and large models
- Mixture-of-experts selective activation
- Tiered storage across HBM, DRAM, CXL, and SSD
- Prompt and state summarization
- Hardware-software co-design
Therefore, agents growing = HBM demand growing at the same rate is not a law of physics. A better benchmark is memory bytes-seconds per useful task completed, multiplied by total task volume. If efficiency improves tenfold but total task volume grows a hundredfold, demand still increases. Conversely, if agent counts rise but most run on short, low-cost models, HBM demand may fall well short of the narrative.
11. Who Is the Ultimate Payer: AI Software Profitability
The infrastructure investment cycle can be sustained only if end customers pay the cost. In early July, a Telegram post shared that Anthropic is profitable in Q2 on a stock-based compensation-excluded basis, and that token-level gross margins on some models exceed 80%.
The sources are a Sequoia interview with Dylan Patel and SemiAnalysis estimates. These are not Anthropic’s audited financial statements. They should be read as interview statements and model-based estimates.
In particular, API list-price token margins and company-wide profitability are different things.
| Item | Included in Token-Level Margin | What Is Additionally Required for Company-Wide Profit |
|---|---|---|
| Inference revenue | Included | Reflect channel discounts and commitments |
| Inference compute | Included | Reflect idle capacity and peak costs |
| Cloud distribution | Partial estimate | Bedrock/Vertex revenue sharing |
| R&D | May be excluded | Large-scale training and headcount |
| Stock-based compensation | May be excluded | Fully diluted cost |
| Sales & marketing | May be excluded | Enterprise sales and customer support |
Even so, the relevance of the software profitability discussion is clear. If end services generate high contribution margins, the capex on GPUs, memory, networking, and power can be sustained. Conversely, if token price competition intensifies and revenue per task falls, it becomes harder for infrastructure providers to maintain high pricing for long.
The true end of the AI supply chain is not HBM shipments.
Amount paid by users
  → AI service gross margin
  → Cloud and model provider capex capacity
  → GPU, memory, networking, and power orders
If cash runs short at any link in this chain, the backlog upstream gets revised later.
12. Korea’s Separate Variable: Single-Stock Leveraged Products
Source documents on the Korean equity market repeatedly claimed that single-stock leveraged products tied to Samsung Electronics and SK Hynix have been absorbing positioning flows and amplifying volatility. A representative post cited cumulative retail buying of ₩14.2 trillion since product launch. This specific cumulative figure and its measurement scope could not be independently verified.
Separately, media reporting noted that during the four trading days around the June sell-off, retail investors net-bought ₩14.3 trillion in KOSPI and deployed ₩10.7 trillion into Samsung Electronics and SK Hynix. The relevant report is the reference. This figure covers a different period and scope than the “₩14.2 trillion cumulative since product launch” figure. The two should not be treated as the same statistic.
What is officially confirmed is the existence of the products and the regulatory risk warnings.
- The Financial Supervisory Service warned on May 27, prior to launch, about the loss amplification and negative compounding effects of single-stock leveraged and inverse products.
- KRX listed the Samsung Electronics single-stock leveraged ETF and an SK Hynix leveraged ETN.
- KRX issued an investor caution regarding the premium/discount to NAV in an SK Hynix futures-leveraged ETF.
- Creation and redemption disclosures for related ETFs appeared in July, indicating that product flows can move in either direction rather than representing fixed buying demand.
12.1 Why Volatility Increases
Leveraged products must rebalance daily to maintain their target multiple. When the underlying rises, they may need to add exposure; when it falls sharply, they may need to reduce it. The exact timing of transactions depends on the mix of futures, swaps, and equity hedges, but the structural tendency is to amplify both upside and downside.
Rising market
→ Leveraged product NAV increases
→ Exposure expansion needed to maintain target multiple
→ Potential additional demand for underlying

Falling market
→ NAV decline and redemptions
→ Hedge reduction and potential futures selling
→ Amplified underlying volatility
This structure does not turn good earnings into bad ones. But it can steepen the price path even on days when fundamentals have not changed. Analyzing Samsung Electronics and SK Hynix therefore requires monitoring ETF NAV, creation and redemption flows, futures basis, and program trading flows alongside earnings forecasts.
13. SK Hynix ADR: The Premium May Be the Price of Friction, Not of Enterprise Value
A post on SK Hynix ADR argued that when real-time arbitrage between the U.S. ADR and the Korean ordinary shares is constrained by settlement lag, taxes, and regulations, an initial ADR premium can emerge. The post also cited a TSMC-like premium range for reference.
This interpretation is plausible but not confirmed. ADR pricing can be framed as follows:
ADR price
≈ Ordinary share price × conversion ratio × FX rate
+ U.S. investor accessibility premium
+ borrow, settlement, tax, and conversion friction
- new supply and arbitrage pressure
Initially, if U.S. investor demand is fast and the supply of ordinaries converted to ADRs is slow, a premium can emerge. But that premium does not mean SK Hynix’s operating income has increased. It is the market structure’s price for friction — one that is likely to compress as conversion and arbitrage normalize.
For an ADR to create long-term value, at least one of the following is needed:
- An expanded U.S. investor base lowers the required rate of return.
- Higher trading liquidity and analyst coverage add a monitoring premium.
- U.S. capital markets provide more favorable financing for capex.
- Index inclusion or the lifting of institutional investment restrictions creates real incremental demand.
Conversely, looking only at the initial premium and double-counting enterprise value across ordinary shares and the ADR would be an error. As discussed in the SK Hynix ADR and leverage structure analysis, the ADR is plumbing layered on top of fundamentals. Plumbing changes price discovery but does not automatically generate cash flow.
14. When Four Signals Collide
The source documents from the first half of July do not all point in the same direction. The four key conflicts are what matter most.
Conflict 1: Memory Prices Are Strong But Volume Is Still Weak
- Nanya’s prices rose more than 60%.
- Shipment volume barely increased.
- Earnings exploded but peak-price risk also increased.
Judgment: In the next quarter, watch bit shipments and customer inventory more than the rate of price appreciation.
Conflict 2: AI Component Revenue Is Diffusing, But Power and Financing Costs Are Rising Too
- Server ODM, power supply, CCL, and copper foil revenues are strong.
- Meta plans 5 GW and more than $50 billion in investment.
- Power financing has expanded to $25 billion.
- Development-stage companies rely on convertible notes and dilutive capital.
Judgment: Watch contract counterparties, cost of capital, and free cash flow more than revenue growth rates.
Conflict 3: Agent Demand Is Growing, But Per-Unit Memory Cost Is Falling
- Long-horizon state, tool use, and inter-agent communication increase total inference volume.
- Compression, caching, tiered storage, and small-model routing lower cost per byte.
Judgment: Watch cost per useful task and total task volume together, not just agent count.
Conflict 4: Korean Memory Companies’ Earnings Are Strong, But the Price Plumbing Is Unstable
- Memory prices and cash flows are strong.
- Single-stock leverage products and ADR expectations amplify the price path.
- Even strong companies can experience sharp drawdowns from redemptions, hedge unwinds, and premium normalization.
Judgment: Earnings estimates and position sizing must be kept separate. Even with high conviction in the business, an unstable positioning structure requires a different approach to entry and sizing.
15. Scenarios from H2 2026 Through 2028
| Scenario | H2 2026 | 2027 | 2028 | Beneficiary | Risk |
|---|---|---|---|---|---|
| A. Orderly excess demand | Memory prices and Taiwan revenue stay strong | Growth continues via long-term contracts and power expansion | New supply absorbed gradually | HBM, eSSD, power supply, cooling, advanced materials | Overvalued option-like developers |
| B. Strong prices, flat volume | ASP drives earnings | Customer inventory and negotiating leverage weigh | Price normalization causes earnings plunge | Low-cost producers, cash-rich companies | Producers with high price sensitivity |
| C. Power and financing delays | Chip orders hold but site delays accumulate | Some projects cancelled or renegotiated | Demand reconcentrates on large operators | Companies with long-term PPAs and strong capital | Developers without pre-contracted revenue |
| D. Simultaneous supply and efficiency improvement | Bull narrative persists | Efficiency gains partially offset demand growth | New fabs and efficiency gains overlap | Low-cost platforms, software | Commodity memory and high-fixed-cost new fabs |
| E. Leverage unwind | Repeated sharp declines disconnected from earnings | Possible product structure adjustment | Prices re-converge to fundamentals | Companies with FCF and buyback capacity | High-leverage chase positions |
The most probable path at present is a mix of A and B. Memory prices and AI component revenues are likely to remain strong in the near term, but whether volume growth and final-service monetization keep pace with price appreciation must be confirmed. 2028 is the first major verification window, when new fabs, power project startups, AI efficiency improvements, and long-term contract renewals all converge.
16. Indicators to Watch: A Checklist for Converting Narrative into Numbers
Memory
| Indicator | Bull Confirmation | Caution Signal |
|---|---|---|
| DRAM ASP and shipment volume | Price and bit shipments both rising | Price rising alone, shipments stagnant |
| Customer inventory | Low inventory and expanding long-term contracts | Front-loading orders followed by inventory surge |
| HBM qualification | Repeated commercial shipments and expanding customer base | Only test yields disclosed, revenue delayed |
| NAND and eSSD | Price, volume, and margin improving together | Only HBM narrative strong while NAND inventory builds |
| Capex | Phased expansion matched to demand | Depreciation growing faster than revenue |
AI Hardware Supply Chain
| Indicator | Bull Confirmation | Caution Signal |
|---|---|---|
| Taiwan monthly revenue | Multiple nodes growing together for 3+ months | Only one or two companies growing, others slowing |
| Advanced materials | Volume and high-value mix both rising | Revenue growth driven only by price increases |
| Inventory and receivables | Growing at roughly the same pace as revenue | Growing faster than revenue |
| Optical networking | 800G and 1.6T volume production confirmed by customers | Only market size forecasts expanding |
Power and Financing
| Indicator | Bull Confirmation | Caution Signal |
|---|---|---|
| Data centers | PPA, named customers, minimum usage commitments | Only target GW announced, customers undisclosed |
| Funding | Long-term low-cost capital, risk sharing | High-yield debt, convertibles, short maturities |
| Cash flow | FCF conversion after commissioning | Capex consistently overwhelming FCF |
| Power costs | Locked in via long-term contracts, predictable | Spot fuel prices and grid costs surging |
Korean Market Structure
| Indicator | Bull Confirmation | Caution Signal |
|---|---|---|
| Leveraged products | NAV premium stable, creation/redemption gradual | Premium widening, sharp redemptions |
| Futures and program flow | Balanced underlying and futures supply/demand | Concentrated end-of-day hedge trading |
| ADR | Smooth conversion, premium stable | Initial premium spikes then new supply floods in |
| Retail positioning | Cash-based diversified buying | Concentrated margin and leverage use |
17. What to Believe and What to Wait For
High-Confidence Conclusions
- Memory price appreciation is materially lifting producer quarterly earnings.
- AI investment has diffused into servers, power supplies, cooling, and advanced PCB materials.
- Power and long-term capital have become the critical bottlenecks in data center construction.
- Single-stock leveraged products can amplify the daily volatility of the underlying asset.
- New memory supply coming online around 2028 is the direct consequence of today’s shortage.
Directionally Sound But Requiring Further Verification
- Samsung Electronics HBM4E trial yield of 70% and per-customer qualification status
- Scale and profitability of Meta’s external AI compute sales
- CPO market size in 2028 and Korean companies’ actual share
- Initial ADR premium range for SK Hynix and its expected duration
- How much the agent economy will independently grow HBM, DRAM, and SSD demand, respectively
Assertions That Cannot Be Supported by Current Evidence
- Inferring that something is true because it appeared frequently in Telegram
- Interpreting the $25 billion financing framework as $25 billion in confirmed revenue for a specific equipment maker
- Assuming all announced data center GW will be commissioned
- Interpreting ADR premiums as evidence of increased enterprise value
- Claiming that agent count and HBM demand grow at the same rate
18. Final Assessment
Two weeks of Telegram data cannot be reduced to a single bull or bear thesis. Instead, the data reveals that the market is simultaneously pricing four different time horizons.
First, this is the time of price. As Nanya’s results show, memory prices are driving earnings higher faster than volume can. In this window, producers’ operating leverage is powerful.
Second, next comes the time of volume diffusion. Monthly revenue from TSMC, Wiwynn, Delta, CCL makers, and HVLP copper foil producers shows that the AI investment invoice is spreading beyond GPUs. But inventory and cash flows must follow.
Third, after that comes the time of power and financing. Meta’s 5 GW and Brookfield’s $25 billion show the scale. Fermi’s convertible notes ask how much of that scale comes back to shareholders as dilution cost.
Fourth, 2028 is the time of supply and efficiency. The fabs being built today by high prices, the generation assets being built today by high power demand, and the efficiency gains being made today by high token costs will all enter the market simultaneously.
What investors should do is not abandon AI infrastructure or pursue it unconditionally. It is to verify where each company sits in the bottleneck structure, whether its growth is driven by price or volume, and who bears the cost and financing burden.
The best companies own the bottleneck, have low cost of capital, generate recurring revenue and cash flow, and can expand capacity in stages. The most dangerous companies announce enormous target capacities but have weak customer contracts and thin financing, and convert stock price appreciation back into dilutive capital.
Telegram does not reveal this distinction in advance. Telegram shows where people are running. From that point, official disclosures, income statements, cash flow statements, and the terms of contracts and financing must be read directly.
Key Source Documents and Official References
- Nanya Technology FY2Q26 Telegram source, Nanya Technology official IR
- TSMC 2026 monthly revenue, TSMC financial calendar
- Wiwynn June revenue source, Delta June revenue source, Co-Tech June revenue source
- Meta Louisiana data center official announcement, Meta · Blue Owl joint venture official announcement
- Brookfield and Bloom Energy $25 billion financing framework
- Fermi SEC filing, Convertible notes final pricing
- Micron U.S. investment official announcement
- FSS single-stock leveraged and inverse product warning, KRX NAV premium/discount investor caution
- Meta excess compute sales report, Related Telegram interpretation
- AI software profitability interview, SemiAnalysis estimates
Data as of July 1–14, 2026. Channel and message counts are based on collected public Telegram posts; July 14 may have partial gaps due to connection errors. Company earnings and investment plans prioritize official sources; brokerage estimates, anonymous reports, and Telegram interpretations are separately identified. This post is a market analysis for informational purposes and does not constitute a recommendation to buy or sell any specific security.