Is AI a bubble? Strip that question down and three simpler ones are left. Who is paying for AI today? How fast is that growing? And is it enough to pay back the data centers being built for it?
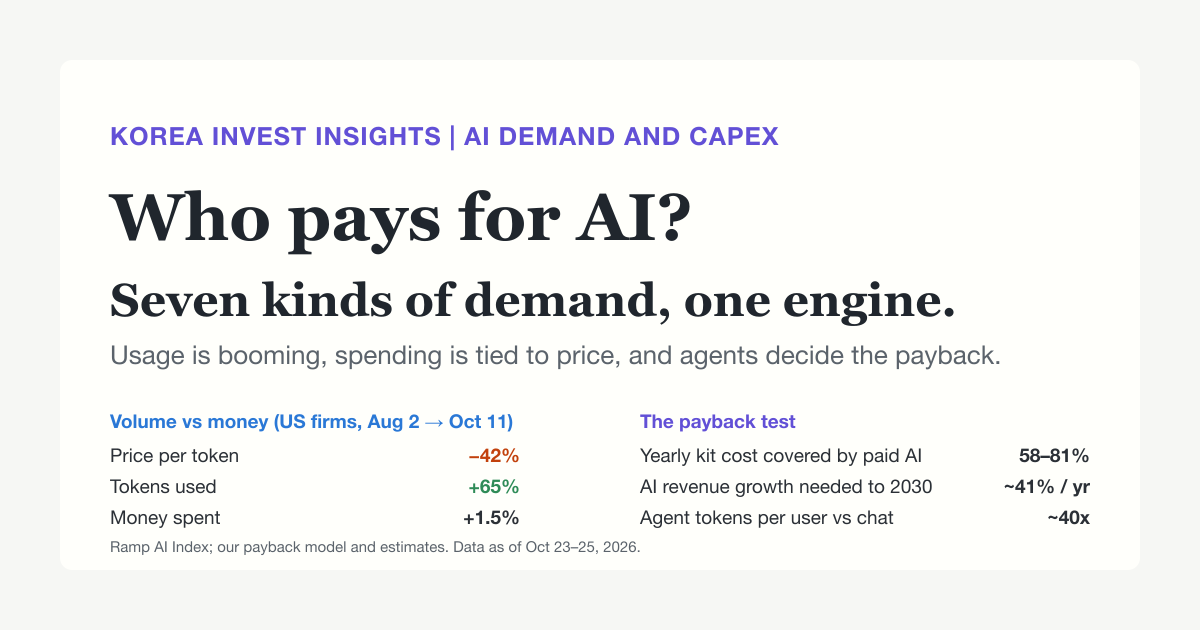
This post answers all three with numbers from our research. The short version: people and companies already pay a lot for AI, and usage is growing faster than almost anything we track. But the price of AI work is falling almost as fast, so spending grows much more slowly than usage. Today, what end customers pay covers roughly 58–81% of the yearly cost of the AI hardware already installed. Big Tech’s other businesses and the capital markets fill the rest.
Whether that gap closes depends mostly on one thing: delegated AI agents. A chatbot answers when you ask. A delegated agent takes a goal, such as “reconcile these invoices” or “watch my inbox and draft replies,” and works on it by itself, often for hours, on a cloud computer of its own.
Five things to take away
- Usage is booming; spending is tied to price. In Ramp’s US business data, the price per token fell 42% from Aug 2 to Oct 11, usage rose 65%, and spending rose 1.5%. Google’s API traffic grew 37.5% in one quarter.12
- There are seven kinds of paid AI demand, and their quality differs a lot. Enterprise and agents are the core and grow fastest. Advertising is the biggest pool, but it mostly moves existing ad budgets. Consumers are wide but shallow. Commerce fees are close to zero.
- Delegated agents are the growth engine. An agent uses about 40 times the tokens of a chat user per day, by our estimate. Agents are spreading fast inside large companies (27% → 40% scaling them), but they have stalled at small firms (about 22%) and among the heaviest users.3
- Payback today depends on who you ask. Compute owners: yes, new rents are 1.6–2.6 times breakeven. Big Tech as a whole: yes, but its return on capital fell from 27.8% to 20.1%. End-customer payments alone: not yet, at 58–81% of the cost.
- Payback tomorrow needs AI revenue to grow about 41% a year to 2030. With prices falling 40–54% a year, usage must grow 2.4–3.1 times a year. Our base case for agent-driven usage in 2027, 2.5–3.0 times, sits right on that line. We put the odds of reaching the 2030 breakeven path at about 45%. Most misses would mean slower payback, not losses.
Data are as of Oct 23–25, 2026. Probabilities and model outputs are our subjective estimates, and we label them as such.
1. Two kinds of demand: volume and money
AI models read and write in small chunks of text called tokens. Tokens measure how much AI work gets done. Dollars measure how much anyone pays for it. Right now those two numbers tell different stories.
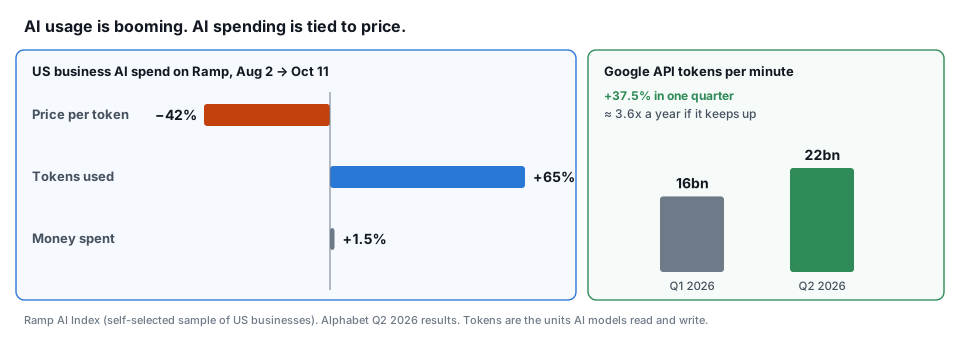
When the price falls 42% and usage rises 65%, the bill barely moves. Economists call this a price elasticity of about 1. In plain words, every time AI gets cheaper, people use more of it, but so far only enough to keep the bill flat.1
The volume side shows no sign of slowing. Google processed 22 billion API tokens a minute in the second quarter, up from 16 billion. At that pace, volume grows about 3.6 times a year.2
Prices are also splitting in two. List prices for the top models rose 66.7% over a year, while mid-tier prices fell 44.5%.4 On OpenRouter, open-weight models handle 72% of tokens but take only 27% of spending. Closed models handle 28% of tokens and take 73%. That makes revenue per token about seven times higher for closed models.5
This split matters for chip investors. Memory chip demand follows tokens, but the money to build data centers follows dollars. A world of cheap, free and open-weight tokens can grow memory demand and still weaken the funding behind it.
2. Seven kinds of paid AI demand
Not every dollar of AI revenue is the same. We sort paid demand by who pays and how. The seven groups overlap, so their sizes should not be added up.
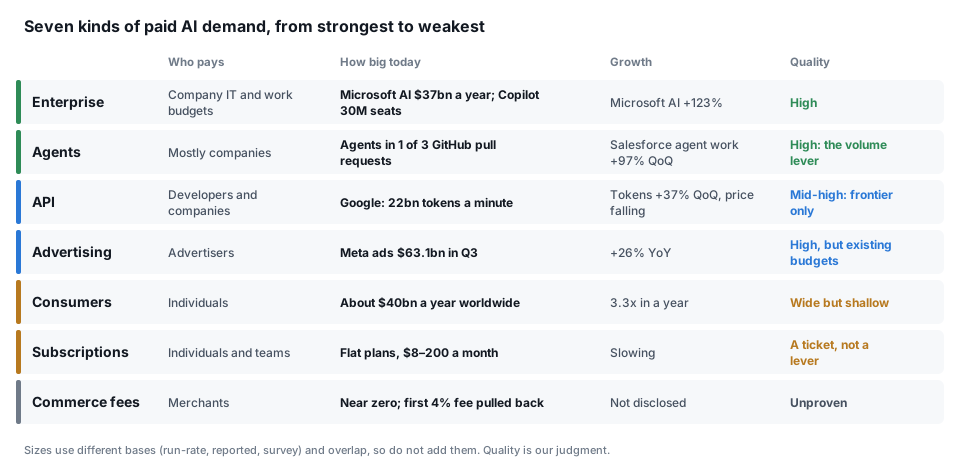
Enterprise: the core of paid demand. Microsoft’s AI business reached an annual run-rate of about $37 billion in the March quarter, up 123%.6 Microsoft 365 Copilot passed 30 million paid seats in July, and net seat additions more than doubled from the prior quarter.7 Even at the $30 list price, 30 million seats come to about $10.8 billion a year, so most of Microsoft’s AI revenue likely comes from cloud usage rather than seats. Salesforce’s Agentforce passed $1.5 billion of annual recurring revenue, up 240%, though the product scope widened this quarter.8 On Ramp, 55.9% of US businesses now pay for AI.1 The weak spot is proof: in one survey, only 9% of companies said they can measure the return on their token spending with high confidence.9
Agents: the volume lever. Agents get their own section below, because they decide most of the growth math.
API: the fastest volume, and the front line of price cuts. Developers and companies buy model access by the token. This is where volume grows fastest and where prices fall hardest. Only frontier models hold their price.
Advertising: the biggest pool, but mostly old money moving. Meta’s ad revenue was $63.06 billion in the third quarter, up 26%, as impressions rose 10% and the average price per ad rose 14%.10 Meta did not say how much of that came from AI. New entrants are small by comparison: ChatGPT ads reached about $1 billion of annualized revenue, roughly 0.4% of Meta’s ad run-rate.11 In the US, ad spending has stayed near 1.3% of GDP for decades, through every media shift. So AI advertising mostly shifts share between incumbents. It funds their capex rather than creating a new market.
Consumers: wide but shallow. Global consumer spending on AI is estimated at $40 billion in 2026, up from $12 billion. Usage barely widened, from 61% to 64% of US adults, so existing users simply paid more. Spread over about 2 billion users worldwide, that is roughly $20 a year each. The top 14% of spenders, at $100 or more a month, account for about 60%, and 55% of US AI users now pay something.12 Large free alternatives keep a lid on prices: Google’s Gemini app has about 950 million monthly users.2
Subscriptions: a ticket, not a lever. Flat plans run from $8 to $200 a month. The heaviest users cost more to serve than they pay, so labs are moving to usage-based pricing, weekly caps and cheaper models. Subscriptions become the entry ticket, and the money comes from usage on top.
Commerce fees: close to zero so far. The first attempt at a 4% in-chat checkout fee was scaled back in March, reportedly because merchants were slow to sign up and retailers protected their customer relationships.13 Meta and Walmart have not disclosed fees for agent shopping. If US agent-driven commerce reaches $300–500 billion by 2030 and fees run 2–4%, that is $6–20 billion a year. That is an assumption, and it will not pay for 2027’s data centers.
One more buyer sits underneath: compute rental. Labs and companies rent computing power, and that market is sold out. Amazon says its 2026 capacity is sold and 2027 is “largely reserved.”14 Cloud backlogs add up to about $2.35 trillion: Microsoft $678 billion, Oracle $664 billion, Google $514 billion and AWS $496 billion. At least 37% of that is tied to two frontier labs.14 One-year rental contracts for H100 GPUs rose about 38% from their October 2025 low to March 2026.15
Three patterns run across all seven kinds:
- Revenue per token differs about sevenfold. Free, open-weight and flat-rate usage grows volume. Frontier enterprise use, agent usage billing and advertising grow revenue.
- Billing is moving from seats to usage to outcomes. GitHub Copilot revenue grew more than 60% in a quarter after it switched to usage-based pricing.7 Usage billing lets revenue follow volume.
- Payment is concentrated. Among consumers, the top 14% pay 60%. Among companies, the top tenth of firms use 8.3 times the output tokens per user of a typical firm.16 On the supply side, at least 37% of cloud backlog sits with two labs.
3. The growth engine: delegated agents
Our working thesis since early October is simple. AI is moving from raw model APIs to packaged agents. An API is like a raw material: powerful, but only skilled builders can use it. A delegated agent is a finished product: you sign up, give it a goal, and it works on a cloud computer of its own.
This form suits both sides. Providers run the inference centrally, so they can control it and make it efficient. Users skip the setup and simply hand work over, which matters most for non-developers doing everyday office tasks. If that spreads beyond programmers, agent traffic grows by multiples, and it runs around the clock.
The product form is now real. Between May and October, Meta, Google, xAI and others launched always-on agents that keep working after you close the app. The open question is how fast people and companies adopt them.
Why agents change the demand math
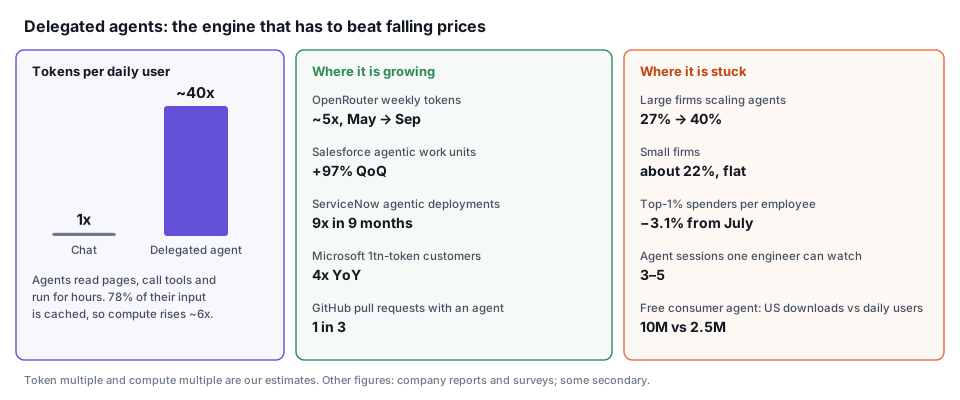
An agent does far more work per user than a chat. By our estimate, a delegated agent uses about 1.86 million tokens a day per daily user, roughly 40 times a chat user. It reads web pages, calls tools, checks its own work and keeps going. About 78% of its input is reused from a cache, so the computing load rises about 6 times rather than 40 times.17 For coding, the gap is wider: agentic coding can use around 1,000 times the tokens of a coding chat, according to one research preprint.
Heavy users show where this leads. In OpenAI’s enterprise data, users at the top tenth of companies produce 8.3 times the output tokens of users at a typical company, up from 2.6 times in January.16
Where it is growing
- OpenRouter’s weekly token volume rose from about 25 trillion in May to 128.4 trillion in mid-September, about 5 times. Part of that is the platform gaining share.5
- Google processed more than 3,200 trillion tokens a month across its services in May, about 7 times a year earlier.18
- Microsoft’s count of Foundry customers running at more than 1 trillion tokens a year quadrupled, and nearly 40 million agents were registered on Agent 365 within two months of launch. An agent is involved in one of every three GitHub pull requests.7
- Salesforce’s agentic work units rose 97% in one quarter.8 ServiceNow says its agentic deployments rose ninefold in nine months.19
Where it is stuck
Agent growth runs on two engines, and only one is fully running.
- The depth engine, heavy users doing more, stalled in July. On Ramp, spending per employee at the top 1% of companies is 3.1% below its July peak.20 The limit is human attention. One engineer can supervise only about three to five agent sessions at a time. If every step needs a check, people become alert handlers, not supervisors.
- The breadth engine, more companies and more kinds of work, runs only at large firms. In McKinsey’s 2026 survey, the share of large companies scaling AI agents rose from 27% to 40%, while small firms stayed around 22%.3 Gartner has predicted that more than 40% of agentic AI projects will be cancelled by the end of 2027.21
- Consumers are mixed. Meta’s free agent, Muse, reached about 10 million US downloads in its first 40 days, helped by heavy promotion across Meta’s own apps. Daily users reached about 2.5 million by Oct 16, and 23% of new users were still active after two weeks, above the 16% average for AI apps.22 An earlier consumer agent, ChatGPT agent, reportedly lost about three-quarters of its users, with paid weekly users falling from about 4 million to under 1 million.23
Billing is catching up with usage. Flat subscriptions make heavy agent use a cost, not revenue. Usage-based and outcome-based pricing turn it into revenue. The unit that matters is shifting from cost per token to cost per accepted, finished task.
Consumer agents are small for compute, unless intensity jumps
We sized personal cloud agents bottom-up. At 100 million daily users and today’s observed use, they need about 0.22–1.0 gigawatts and $9–52 billion of capex, about 0.6–4% of 2027 spending. The user count matters less than intensity. At the free-tier limit of about 14.3 million tokens a day, the same 100 million users would need 4.7–31% of 2027 capex.17
Agents change what the hardware looks like
An agent’s own cloud computer needs CPUs and ordinary memory, not just AI chips. One measured personal-agent machine used 2 virtual CPUs and 7.7 GB of memory with no GPU. Data-center designs are shifting from one CPU per four GPUs toward one per two, or one to one. A one-million-token context can need about 328 GB of working memory, more than the 288 GB of high-bandwidth memory on a top GPU.17 Compared with chatbots, agents use about 50 times more CPU-side memory and 28–60 times more storage.
That fits the last part of our thesis. Computing will keep getting more efficient. What keeps piling up is context and accumulated knowledge, which live in memory and storage.
4. How big is the bill?
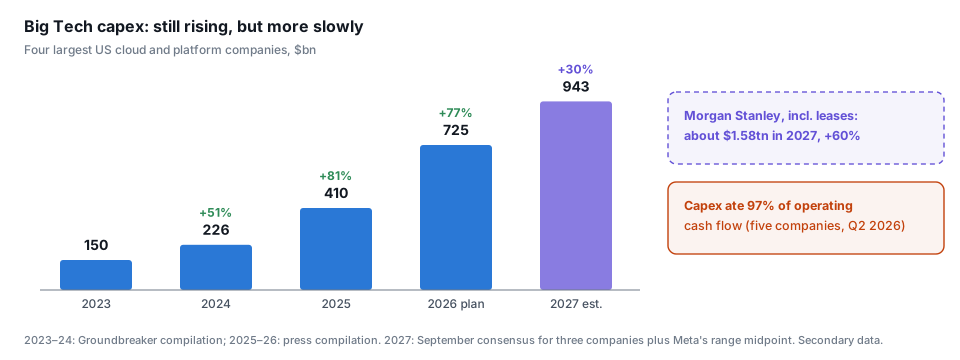
The four biggest US platforms went from about $150 billion of capex in 2023 to a planned $725 billion in 2026.24 Growth is slowing, from +77% this year to somewhere between +30% and +60% in 2027, depending on whose tally you use. Even at the low end, these four companies would spend about $220 billion more in 2027 than in 2026.25
The money no longer comes from spare cash. At five hyperscalers, capex took 97% of operating cash flow in the second quarter.26 Meta’s free cash flow turned negative in the third quarter.10 Slower growth is already expected. What breaks this kind of cycle is not slower growth. It is a failure to refinance, which we covered in our credit-squeeze post.
5. Does AI pay for itself today?
The honest answer is “partly.” It depends on which layer you look at.
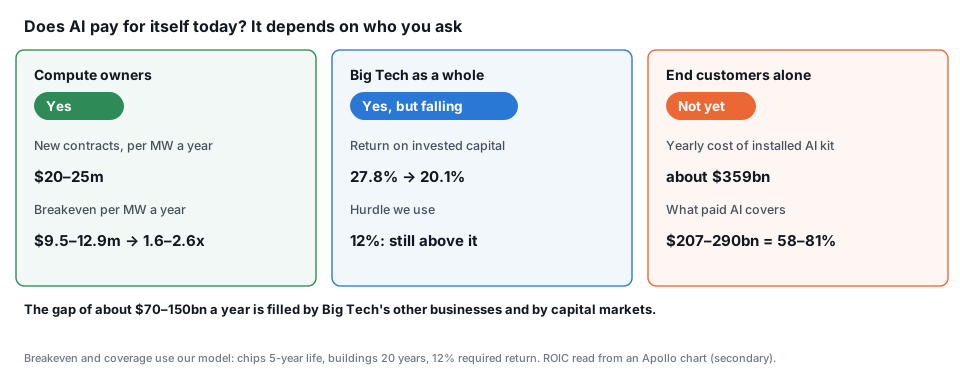
Compute owners: yes. Estimates of what one gigawatt of AI data center costs range from about $35–40 billion to $50 billion or more, depending on what is counted. We use $37–50 billion.27 Suppose the chips are 70% of that and last five years, the buildings are 30% and last 20 years, the owner wants a 12% return, and running costs are $1–1.5 million per megawatt a year. Then breakeven rent is about $9.5–12.9 million per megawatt a year. Nebius says its second-quarter bookings averaged more than $20 million of revenue per megawatt, and its largest contracts ran $20–25 million per megawatt a year. That is about 1.6–2.6 times breakeven.28 By our tracking, rents on older GPUs have also risen more than 30% since the first quarter, a sign that chips stay useful longer than the three years bears fear. CoreWeave’s fleet average, about $10 million per megawatt by one broker’s estimate, sits near breakeven. Timing and chip generation decide who earns the most.
Big Tech as a whole: yes, but the return is falling. The five largest hyperscalers’ return on invested capital fell from about 27.8% to 20.1% between late 2024 and March 2026.29 Most of that drop comes from spending running ahead of revenue. The return is still well above a 12% hurdle.
End customers alone: not yet. Here is the math in four steps.
- Installed base. About $931 billion of AI capex over the past three and a half years plus about $500 billion in the second half of 2026 comes to about $1.43 trillion.
- Yearly cost. Depreciation of about $222 billion plus a 12% return on the remaining book value of about $1.14 trillion, or about $137 billion, adds up to about $359 billion a year.
- What customers pay. AI revenue is estimated to reach an annual run-rate of $414 billion by the end of 2026.30 After staff, sales and revenue-sharing costs, about 50–70% of that is left to pay for hardware: $207–290 billion.
- Coverage. That covers about 58–81% of the yearly cost, leaving a gap of about $70–150 billion a year.31
Two pockets fill the gap. One is the cash from Big Tech’s existing businesses, which shows up as a falling return on capital. The other is equity and debt that labs and neoclouds raise against future demand. In plain words, the landlords are doing fine and the big tenants are paying. The end customers do not yet pay the full rent, and investors cover the difference in the hope that demand keeps growing.
6. Can it pay off tomorrow?
Four conditions have to hold.
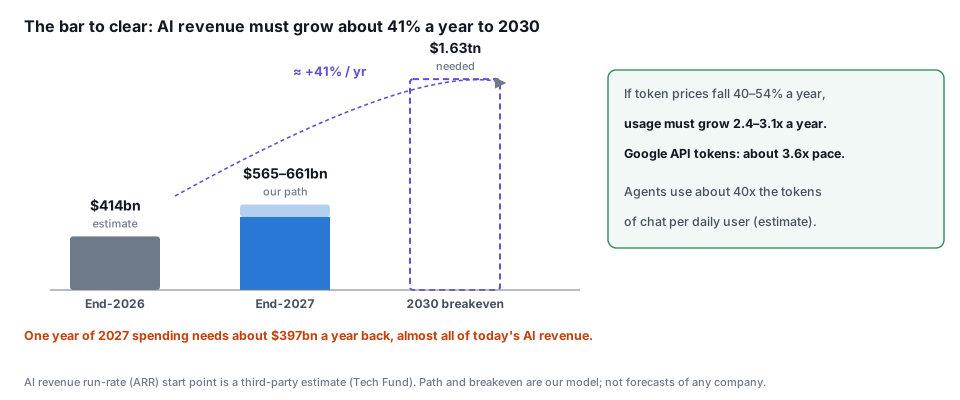
AI revenue must grow about 41% a year for four years. In our model, AI revenue needs to reach about $1.63 trillion in 2030 to cover the yearly cost of everything built from 2026 to 2030. From $414 billion, that is about 41% a year. Our channel-by-channel path puts the end-2027 run-rate at $565–661 billion, and about 60% of that increase comes from frontier labs’ enterprise and agent sales. Even on that path, 2028–2030 still needs 35–42% a year.31
One year of spending needs almost all of today’s AI revenue. Morgan Stanley counts about $1.58 trillion of 2027 spending across the largest spenders, including leases.25 Its yearly cost comes to about $397 billion, about 96% of today’s AI revenue run-rate. Payback on that vintage starts in 2028.
Volume must do the work, not price. Like-for-like token prices fall 40–54% a year.32 For spending to grow 41% a year, usage must grow 2.4–3.1 times a year. Because cheaper prices have so far only kept the bill flat, that extra usage has to come from new kinds of work. Delegated agents are the main candidate. Today’s pace is enough: Google’s API volume is growing at about 3.6 times a year.
Proof will be demanded in 2027–28. Only 9% of companies say they can measure the return on token spending with high confidence, and for 74% token spending is still under 10% of the IT budget.9 If budgets grow as planned, the questions get sharper in the 2027–28 budget cycle, exactly when the 2027 vintage needs to start paying back.
Do agents grow fast enough?
This is where the two halves of the story meet.
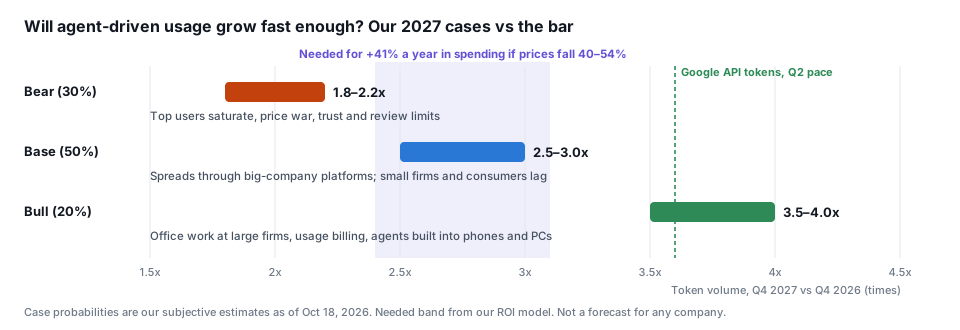
Our 2027 cases for token volume came from the agent research above. In the base case, agents spread through big-company platforms like Copilot and Agentforce while small firms and consumers lag, and volume grows 2.5–3.0 times. That lands inside the 2.4–3.1 times the payback math needs. The bull case, with agents doing office work across large firms and built into phones and PCs, clears the bar easily. The bear case, where top users saturate and trust and review limits bite, falls short.
So the capex payback question is, to a large degree, a question about delegated agents. Do they spread beyond the heaviest users and the largest companies, and does billing follow the usage?
Putting it together, we see about a 60% chance that AI revenue reaches $580 billion or more by the end of 2027, and about a 75% chance that growth then holds at 35–42% a year through 2030. Combined, that is about 45% for the 2030 breakeven path. All three numbers are subjective.31
7. If it falls short, who gets hurt?
Missing the path mostly means slower payback, not outright losses. Gartner estimates that AI infrastructure needs $8.5 trillion of revenue by 2030 against a forecast of $3.6 trillion.33 In our model, 70–90% of that gap reflects how quickly the hardware must pay back. On a normal depreciation schedule, the gap shrinks a lot.
The pain would also fall unevenly.
- Big Tech, the cash layer: return on capital falls further toward the hurdle. Existing businesses and investment-grade debt absorb it.
- Frontier labs: lower valuations and renegotiated compute commitments. They are the most directly exposed to paid-demand growth.
- Neoclouds and Oracle, the borrowed layer: credit losses. Their average rents sit near breakeven, their contracts are short and their capital is the most expensive.
8. What it means for memory chips
- 2026–27: Rents are above breakeven and computing is sold out, so builders still want to add capacity. Memory volumes are set by contracts and supply limits, not by the slower growth of AI spending.
- 2028: Whether the 2027 vintage visibly pays back will decide how easily 2028 capex gets funded. That test overlaps with memory price talks in the second half of 2027.
- The mix shifts toward memory and storage. Agents add demand for CPUs, server DRAM and SSDs, not only for high-bandwidth memory. By our estimate, 12–15% of agent inference spending goes to non-HBM parts in the base case, and 29–33% in the bull case.17
9. What to watch
- Oct 29–30, Microsoft, Alphabet, Amazon. Copilot seats and the AI run-rate; whether capacity is still short of demand. Alphabet’s API tokens: growth of 30% or more a quarter is bullish, under 15% is bearish. AWS growth and backlog.
- Nov 11 KST, CoreWeave third quarter. Revenue per megawatt against our $9.5–12.9 million breakeven.
- About Nov 13, Ramp AI Index. October spending up 5% or more from September would suggest volume is starting to beat price.
- Mid-November, Muse daily users. Falling below half of the peak would weaken the consumer-agent case.
- Our longer thresholds. AI revenue of $580 billion or more by the end of 2027 strengthens the case, and under $500 billion weakens it. New contract rents under $13 million per megawatt, or 15% or more of companies freezing or cutting AI budgets, would also weaken it.
Our read
AI pays for itself today at the layers that own computing and in Big Tech’s overall returns. It does not yet pay for itself from end customers alone. The future case is conditional, not hopeless: AI revenue has to grow about 41% a year for four years while prices keep falling, and current volume growth is fast enough to do that.
The single most important variable is no longer whether people use AI. They clearly do. It is whether delegated agents turn cheaper tokens into more finished work, fast enough, outside the top 1% of users and the largest companies.
Your turn
Is your company using AI agents beyond a pilot yet, and who supervises them? Which of the seven kinds of demand do you think will carry the bill in 2028? Tell me in the comments. I read every one.
If a friend keeps asking whether AI is a bubble, send them this post. Sharing it helps more investors find the numbers behind the debate.
Interest note: We use AI models, including Anthropic’s Claude, in our research. Anthropic is among the frontier labs counted in the lab and backlog figures above. We cite public figures only and make no judgment about any single lab.
Disclaimer: For research and information purposes only. Not investment advice. Names cited are for analytical illustration; readers should perform their own due diligence and consult licensed advisors before any investment decision.
Ramp AI Index, October 2026, 2026-10-14: paid AI adoption 55.9%. Token price, volume and spending for Aug 2 to Oct 11 come from the weekly token index in the edition’s charts (volume 744 → 1,225, spending 605 → 614, price per million tokens $1.10 → $0.64). That index draws on Ramp’s token-spend management product, not card data, and Ramp says the sample is not representative. ↩︎ ↩︎ ↩︎
Alphabet second-quarter 2026 results, CEO remarks, 2026-07-22: 22 billion API tokens per minute, up from 16 billion a quarter earlier; Google Cloud revenue +82%; Cloud backlog $514 billion. The annual pace is our calculation. ↩︎ ↩︎ ↩︎
McKinsey, The state of AI in 2026. The large-company figure is the share of respondents at companies with $1 billion or more in revenue that are scaling agents; small-firm figure as summarized by secondary sources. ↩︎ ↩︎
BenchLM token price index, as reported in October 2026. Secondary. ↩︎
OpenRouter, The Token State of Play, 2026-09-22: weekly token volume and the spending mix by model type. ↩︎ ↩︎
UC Today, 2026-04-30, on Microsoft’s March-quarter AI run-rate. Secondary. ↩︎
Microsoft fiscal fourth-quarter 2026 results, 2026-07-29, and the earnings call transcript: Copilot seats, commercial RPO of $678 billion, one in three GitHub pull requests involving an agent, GitHub Copilot revenue up more than 60% quarter on quarter after usage-based pricing, Foundry customers at a 1-trillion-token run-rate up 4x, and nearly 40 million agents on Agent 365. ↩︎ ↩︎ ↩︎
Salesforce fiscal second-quarter 2027 results, 2026-08-26: Agentforce ARR above $1.5 billion, up more than 240%, and agentic work units up 97% quarter on quarter. The ARR definition widened this quarter. ↩︎ ↩︎
The AI Innovator, 2026-10-05, on a Bloomberg Intelligence survey of about 100 enterprise respondents. Secondary. ↩︎ ↩︎
Meta third-quarter 2026 results (SEC 8-K, Exhibit 99.1), 2026-10-21. ↩︎ ↩︎
Digiday, 2026-08-31: a monthly figure times 12. Secondary. ↩︎
Menlo Ventures, 2026: The State of Consumer AI, 2026-09-16. Survey-based estimates. Menlo Ventures invests in AI companies. ↩︎
Press reports in March 2026 on the scaling back of in-chat checkout. Secondary. ↩︎
Amazon second-quarter 2026 earnings call, 2026-07-30 (AWS backlog and capacity comments); Oracle fiscal first-quarter 2027 results, 2026-09-10 (RPO); Microsoft and Google backlogs from the releases above. The 37% two-lab share is our lower-bound sum of reported contracts with mixed dates and definitions. ↩︎ ↩︎
SemiAnalysis GPU Pricing Index: H100 one-year contract index about $1.70 per GPU-hour in October 2025 and about $2.35 in March 2026, as recorded in our dataset. Secondary. ↩︎
VKTR, on OpenAI enterprise data, August 2026: top-decile firms versus a typical firm. Secondary. ↩︎ ↩︎
Our personal-agent and delegated-agent sizing models (September–October 2026), built on published measurements of agent sessions and hardware specifications. Estimates, not company data. The coding multiple is from a research preprint. ↩︎ ↩︎ ↩︎ ↩︎
Google I/O 2026 keynote, May 2026, as reported by Shacknews: 3.2 quadrillion tokens a month, about 7x a year earlier. ↩︎
ServiceNow second-quarter 2026 results, 2026-07-22: chief executive’s comment that agentic deployments increased ninefold in nine months. ↩︎
Ramp AI Index, October 2026, as summarized by explainx: top-1% spending per employee $9,873 at the July peak and $9,568 in September. Secondary. ↩︎
Gartner press release, 2025-06-25. ↩︎
TechCrunch, citing Sensor Tower, October 2026: US downloads in the first 40 days, daily users on Oct 16, and 14-day retention against the AI-app average. Meta’s launch announcement was 2026-09-08. Secondary. ↩︎
The Decoder, citing The Information, 2026. Secondary. ↩︎
2023–2024 as compiled by Groundbreaker, July 2026; 2025–2026 from Yahoo Finance and other press compilations; 2027 is September consensus for Microsoft, Alphabet and Amazon plus the midpoint of Meta’s range. Secondary. ↩︎
Morgan Stanley’s October 2026 note, as reported by Tiger Brokers: about $1.58 trillion of 2027 spending including leases, up about 60%. Secondary. ↩︎ ↩︎
Our reconstruction from SEC XBRL filings for five hyperscalers: capex divided by operating cash flow, second quarter of 2026. ↩︎
Bernstein, about $35–40 billion per gigawatt (summary); Foxconn, about $47 billion; Nvidia’s chief executive, $50 billion or more (Yahoo Finance). Definitions differ (racks only versus full sites), so the range is approximate. Secondary. ↩︎
Nebius second-quarter 2026 shareholder letter (Form 6-K, Exhibit 99.2), 2026-08-12. ↩︎
Apollo Daily Spark, “Slowing Token Spend Shows Compute Demand Isn’t Unlimited”, 2026-10-20. The ROIC values are read from its chart (about ±0.5 percentage point). ↩︎
Tech Fund, “AI’s attractive IRR”, 2026-10-18: end-2026 AI annual recurring revenue estimate across labs, advertising, cloud and apps. Third-party estimate. ↩︎
Our payback model: chips 70% of cost over five years, buildings 30% over 20 years, 12% required return on 80% of book value, contribution margin of 50–70%. Capex path 2026–2030 of $1.0, 1.2, 1.4, 1.6 and 1.8 trillion. Probabilities are subjective. A three-year chip life raises the bar; an 8.5% cost of capital lowers it. ↩︎ ↩︎ ↩︎
Silicon Data token price index (about −54% a year) and other like-for-like price series. Secondary. ↩︎
Gartner press release, 2026-10-14; the revenue figures as reported by Crypto Briefing. Secondary for the figures. ↩︎