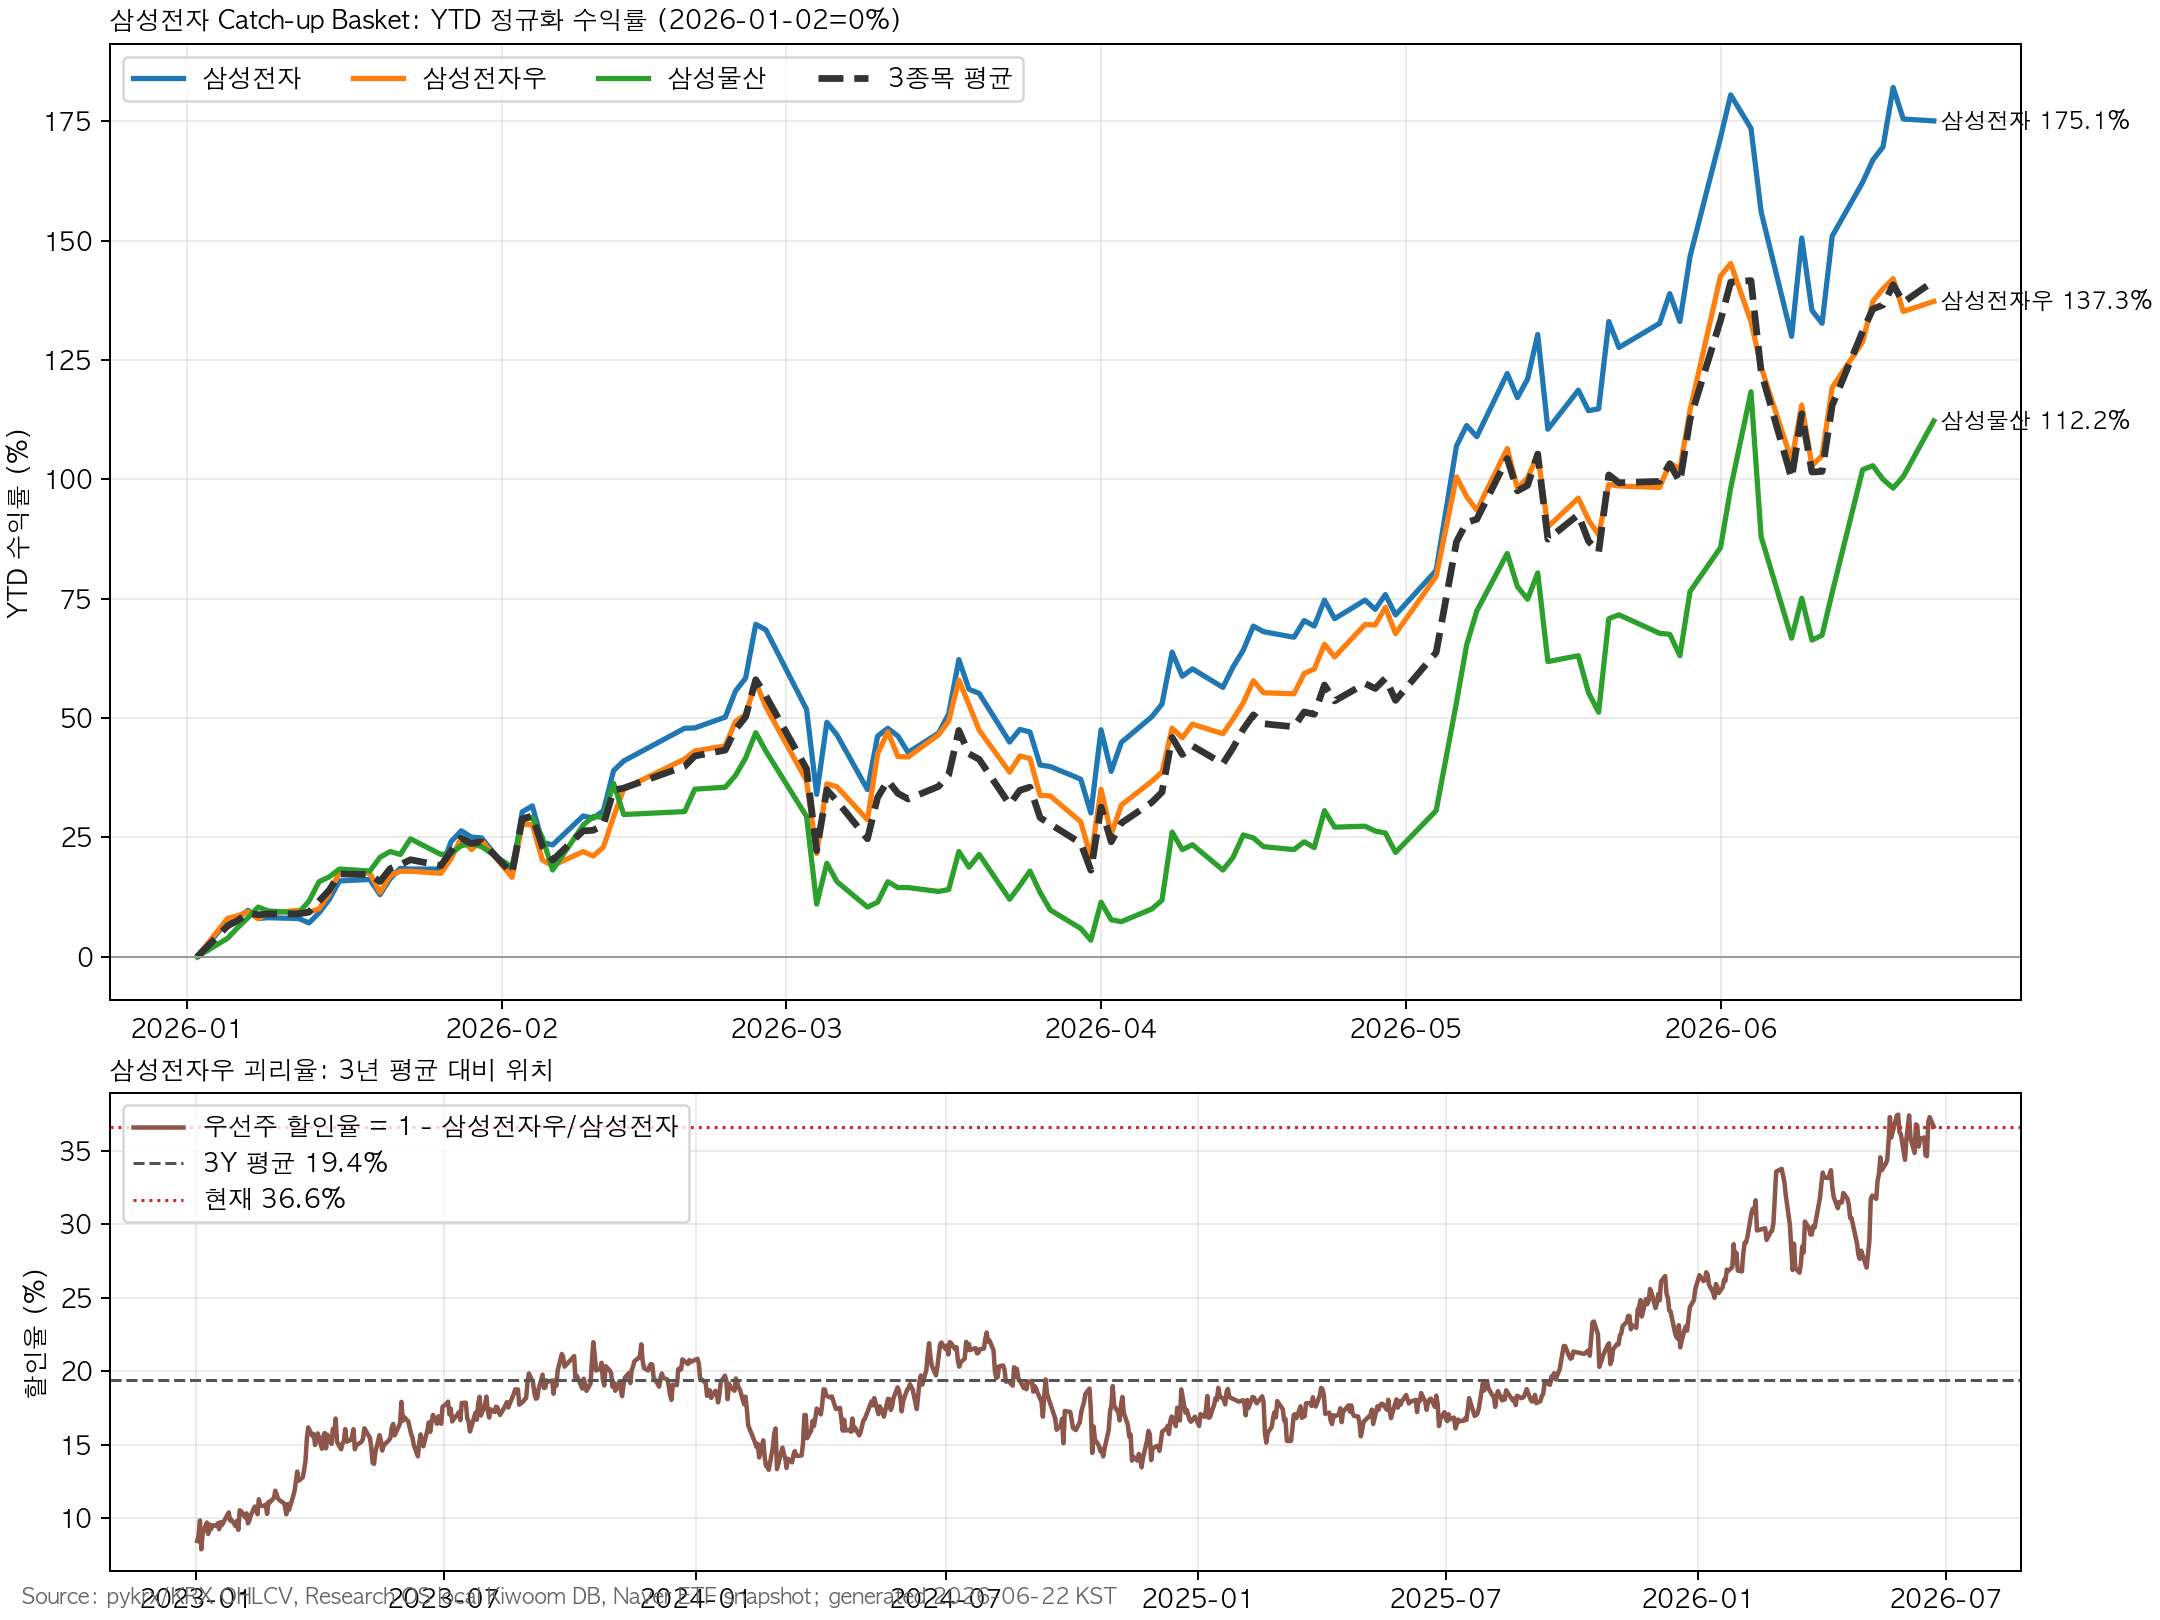
Bản đồ cô đọng cho luận điểm catch-up của Samsung Electronics qua cổ phiếu thường, cổ phiếu ưu đãi và Samsung C&T.
Cách thể hiện giao dịch catch-up của Samsung Electronics
Cổ phiếu thường Samsung Electronics đã tăng mạnh nhờ HBM, chu kỳ bộ nhớ và kỳ vọng hoàn trả dòng tiền tự do. Câu hỏi là nên thể hiện cùng một luận điểm bằng cổ phiếu thường, cổ phiếu ưu đãi hay Samsung C&T.
Tóm tắt
Samsung Electronics preferred is the cleaner catch-up expression. It lagged the common by 37.8 percentage points YTD and traded at a 36.6% discount on 22 June 2026.
The discount is extreme: 36.6% versus a 19.4% three-year average, 18.1% median, +3.11 z-score, and 99.1st percentile.
Samsung C&T is not a one-for-one Samsung Electronics proxy. It is a NAV and affiliate-dividend story.
ETF cap spillover is secondary. A simple redistribution assumption implies only about KRW 24.6bn into Samsung Electronics preferred and KRW 46.0bn into Samsung C&T.
Dữ liệu chính
Stock
2 Jan Close
22 Jun Close
YTD
Versus Samsung Electronics
Samsung Electronics
KRW 128,500
KRW 353,500
+175.1%
Baseline
Samsung Electronics preferred
KRW 94,400
KRW 224,000
+137.3%
-37.8pp
Samsung C&T
KRW 245,000
KRW 520,000
+112.2%
-62.9pp
Metric
Samsung Electronics
Samsung Electronics Preferred
Samsung C&T
20D return
+18.0%
+19.3%
+24.3%
60D return
+86.3%
+67.0%
+84.7%
Correlation with Samsung Electronics
1.000
0.949
0.779
Beta to Samsung Electronics
1.000
0.912
0.848
Chiết khấu cổ phiếu ưu đãi
Metric
Value
Preferred/common ratio
63.37%
Current discount
36.63%
Three-year average discount
19.43%
Three-year median discount
18.14%
Current z-score
+3.11
Three-year percentile
99.1%
Preferred/Common Ratio
Implied Preferred Price
Upside
Current 63.4%
KRW 224,000
Baseline
70.0%
KRW 247,450
+10.5%
75.0%
KRW 265,125
+18.4%
80.0%
KRW 282,800
+26.3%
85.0%
KRW 300,475
+34.1%
NAV của Samsung C&T
Samsung C&T is calculated to hold 298,818,100 Samsung Electronics shares. At KRW 353,500, that stake is worth about KRW 105.6tn. Samsung C&T’s estimated market cap is about KRW 84.3tn.
Foreign selling slows, program selling eases, 20-day moving average holds
The key conclusion is that the next Samsung Electronics catch-up alpha is more likely to come from preferred-share discount normalization than from ETF cap spillover.